
Universal Display (NASDAQ:OLED) Is Doing The Right Things To Multiply Its Share Price
Universal Display (NASDAQ:OLED) Is Doing The Right Things To Multiply Its Share Price
What trends should we look for it we want to identify stocks that can multiply in value over the long term? Amongst other things, we'll want to see two things; firstly, a growing return on capital employed (ROCE) and secondly, an expansion in the company's amount of capital employed. Ultimately, this demonstrates that it's a business that is reinvesting profits at increasing rates of return. With that in mind, we've noticed some promising trends at Universal Display (NASDAQ:OLED) so let's look a bit deeper.
我們應該尋找哪些趨勢?我們想確定可以長期價值成倍增長的股票?除其他外,我們希望看到兩件事;首先,成長 返回 論資本使用率(ROCE),其次是公司的擴張 金額 所用資本的比例。歸根結底,這表明這是一家以更高的回報率對利潤進行再投資的企業。考慮到這一點,我們注意到環球顯示器(納斯達克股票代碼:OLED)的一些令人鼓舞的趨勢,所以讓我們更深入地了解一下。
Return On Capital Employed (ROCE): What Is It?
資本使用回報率(ROCE):這是什麼?
If you haven't worked with ROCE before, it measures the 'return' (pre-tax profit) a company generates from capital employed in its business. Analysts use this formula to calculate it for Universal Display:
如果你以前沒有與ROCE合作過,它會衡量公司從其業務中使用的資本中產生的 “回報”(稅前利潤)。分析師使用以下公式來計算環球顯示器的利潤:
Return on Capital Employed = Earnings Before Interest and Tax (EBIT) ÷ (Total Assets - Current Liabilities)
已動用資本回報率 = 息稅前收益 (EBIT) ¥(總資產-流動負債)
0.14 = US$217m ÷ (US$1.7b - US$119m) (Based on the trailing twelve months to December 2023).
0.14 = 2.17億美元 ÷(17億美元-1.19億美元) (基於截至2023年12月的過去十二個月)。
So, Universal Display has an ROCE of 14%. In absolute terms, that's a satisfactory return, but compared to the Semiconductor industry average of 9.7% it's much better.
因此,環球顯示器的投資回報率爲14%。從絕對值來看,這是一個令人滿意的回報,但與半導體行業9.7%的平均水平相比,回報要好得多。
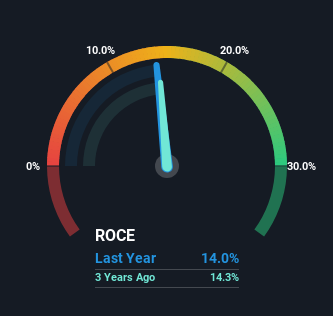
Above you can see how the current ROCE for Universal Display compares to its prior returns on capital, but there's only so much you can tell from the past. If you'd like to see what analysts are forecasting going forward, you should check out our free analyst report for Universal Display .
在上面你可以看到環球顯示器當前的投資回報率與其先前的資本回報率相比如何,但從過去可以看出來的只有那麼多。如果你想了解分析師對未來的預測,你應該查看我們爲環球顯示提供的免費分析師報告。
What Can We Tell From Universal Display's ROCE Trend?
我們可以從環球顯示的ROCE趨勢中得出什麼?
Universal Display is displaying some positive trends. The numbers show that in the last five years, the returns generated on capital employed have grown considerably to 14%. The company is effectively making more money per dollar of capital used, and it's worth noting that the amount of capital has increased too, by 94%. This can indicate that there's plenty of opportunities to invest capital internally and at ever higher rates, a combination that's common among multi-baggers.
環球顯示出一些積極的趨勢。數字顯示,在過去五年中,所用資本的回報率已大幅增長至14%。實際上,該公司每使用1美元資本就能賺更多的錢,值得注意的是,資本金額也增加了94%。這可能表明,內部有很多機會以更高的利率進行資本投資,這種組合在多袋公司中很常見。
The Key Takeaway
關鍵要點
In summary, it's great to see that Universal Display can compound returns by consistently reinvesting capital at increasing rates of return, because these are some of the key ingredients of those highly sought after multi-baggers. Investors may not be impressed by the favorable underlying trends yet because over the last five years the stock has only returned 0.3% to shareholders. So exploring more about this stock could uncover a good opportunity, if the valuation and other metrics stack up.
總而言之,很高興看到環球顯示能夠通過持續地以更高的回報率進行資本再投資來增加回報,因爲這些是那些備受追捧的多袋機的一些關鍵要素。有利的潛在趨勢可能還不會給投資者留下深刻的印象,因爲在過去五年中,該股向股東的回報率僅爲0.3%。因此,如果估值和其他指標相提並論,進一步探索這隻股票可能會發現一個很好的機會。
Universal Display does come with some risks though, we found 2 warning signs in our investment analysis, and 1 of those is significant...
但是,環球顯示確實存在一些風險,我們在投資分析中發現了2個警告信號,其中一個是重大的...
While Universal Display may not currently earn the highest returns, we've compiled a list of companies that currently earn more than 25% return on equity. Check out this free list here.
儘管環球顯示目前可能無法獲得最高的回報,但我們編制了一份目前股本回報率超過25%的公司名單。在這裏查看這個免費清單。
Have feedback on this article? Concerned about the content? Get in touch with us directly. Alternatively, email editorial-team (at) simplywallst.com.
This article by Simply Wall St is general in nature. We provide commentary based on historical data and analyst forecasts only using an unbiased methodology and our articles are not intended to be financial advice. It does not constitute a recommendation to buy or sell any stock, and does not take account of your objectives, or your financial situation. We aim to bring you long-term focused analysis driven by fundamental data. Note that our analysis may not factor in the latest price-sensitive company announcements or qualitative material. Simply Wall St has no position in any stocks mentioned.
對這篇文章有反饋嗎?對內容感到擔憂?直接聯繫我們。 或者,給編輯團隊 (at) simplywallst.com 發送電子郵件。
Simply Wall St的這篇文章本質上是籠統的。我們僅使用公正的方法根據歷史數據和分析師的預測提供評論,我們的文章無意作爲財務建議。它不構成買入或賣出任何股票的建議,也沒有考慮到您的目標或財務狀況。我們的目標是爲您提供由基本數據驅動的長期重點分析。請注意,我們的分析可能不考慮最新的價格敏感型公司公告或定性材料。簡而言之,華爾街沒有持有任何上述股票的頭寸。
譯文內容由第三人軟體翻譯。