
 Yahoo Finance
 Hoe Leong (SGX:H20) Is Experiencing Growth In Returns On Capital
If we want to find a stock that could multiply over the long term, what are the underlying trends we should look for? Typically, we'll want to notice a trend of growing return on capital employed (ROCE) and alongside that, an expanding base of capital employed. Ultimately, this demonstrates that it's a business that is reinvesting profits at increasing rates of return. Speaking of which, we noticed some great changes in Hoe Leong's (SGX:H20) returns on capital, so let's have a look.
Understanding Return On Capital Employed (ROCE)
For those that aren't sure what ROCE is, it measures the amount of pre-tax profits a company can generate from the capital employed in its business. To calculate this metric for Hoe Leong, this is the formula:
Return on Capital Employed = Earnings Before Interest and Tax (EBIT) ÷ (Total Assets - Current Liabilities)
0.041 = S$1.2m ÷ (S$45m - S$15m) (Based on the trailing twelve months to December 2023).
So, Hoe Leong has an ROCE of 4.1%. In absolute terms, that's a low return and it also under-performs the Machinery industry average of 6.9%.
Check out our latest analysis for Hoe Leong
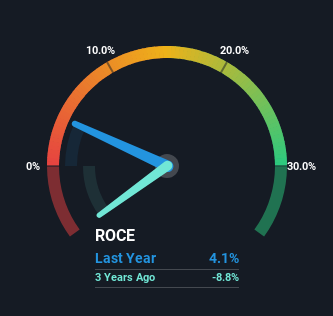
Historical performance is a great place to start when researching a stock so above you can see the gauge for Hoe Leong's ROCE against it's prior returns. If you'd like to look at how Hoe Leong has performed in the past in other metrics, you can view this free graph of Hoe Leong's past earnings, revenue and cash flow.
What Can We Tell From Hoe Leong's ROCE Trend?
Like most people, we're pleased that Hoe Leong is now generating some pretax earnings. While the business is profitable now, it used to be incurring losses on invested capital five years ago. At first glance, it seems the business is getting more proficient at generating returns, because over the same period, the amount of capital employed has reduced by 30%. The reduction could indicate that the company is selling some assets, and considering returns are up, they appear to be selling the right ones.
In Conclusion...
In a nutshell, we're pleased to see that Hoe Leong has been able to generate higher returns from less capital. And since the stock has fallen 60% over the last five years, there might be an opportunity here. With that in mind, we believe the promising trends warrant this stock for further investigation.
On a final note, we found 3 warning signs for Hoe Leong (1 makes us a bit uncomfortable) you should be aware of.
If you want to search for solid companies with great earnings, check out this free list of companies with good balance sheets and impressive returns on equity.
Have feedback on this article? Concerned about the content? Get in touch with us directly. Alternatively, email editorial-team (at) simplywallst.com.
This article by Simply Wall St is general in nature. We provide commentary based on historical data and analyst forecasts only using an unbiased methodology and our articles are not intended to be financial advice. It does not constitute a recommendation to buy or sell any stock, and does not take account of your objectives, or your financial situation. We aim to bring you long-term focused analysis driven by fundamental data. Note that our analysis may not factor in the latest price-sensitive company announcements or qualitative material. Simply Wall St has no position in any stocks mentioned.
