
 Yahoo Finance
 Returns On Capital Signal Tricky Times Ahead For Unimech Group Berhad (KLSE:UNIMECH)
What trends should we look for it we want to identify stocks that can multiply in value over the long term? Firstly, we'll want to see a proven return on capital employed (ROCE) that is increasing, and secondly, an expanding base of capital employed. If you see this, it typically means it's a company with a great business model and plenty of profitable reinvestment opportunities. Having said that, from a first glance at Unimech Group Berhad (KLSE:UNIMECH) we aren't jumping out of our chairs at how returns are trending, but let's have a deeper look.
Return On Capital Employed (ROCE): What Is It?
For those that aren't sure what ROCE is, it measures the amount of pre-tax profits a company can generate from the capital employed in its business. To calculate this metric for Unimech Group Berhad, this is the formula:
Return on Capital Employed = Earnings Before Interest and Tax (EBIT) ÷ (Total Assets - Current Liabilities)
0.11 = RM48m ÷ (RM538m - RM111m) (Based on the trailing twelve months to December 2023).
Therefore, Unimech Group Berhad has an ROCE of 11%. That's a relatively normal return on capital, and it's around the 9.4% generated by the Machinery industry.
Check out our latest analysis for Unimech Group Berhad
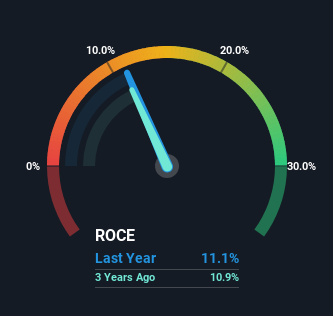
Historical performance is a great place to start when researching a stock so above you can see the gauge for Unimech Group Berhad's ROCE against it's prior returns. If you'd like to look at how Unimech Group Berhad has performed in the past in other metrics, you can view this free graph of Unimech Group Berhad's past earnings, revenue and cash flow.
What Can We Tell From Unimech Group Berhad's ROCE Trend?
When we looked at the ROCE trend at Unimech Group Berhad, we didn't gain much confidence. Over the last five years, returns on capital have decreased to 11% from 14% five years ago. Meanwhile, the business is utilizing more capital but this hasn't moved the needle much in terms of sales in the past 12 months, so this could reflect longer term investments. It may take some time before the company starts to see any change in earnings from these investments.
On a side note, Unimech Group Berhad has done well to pay down its current liabilities to 21% of total assets. That could partly explain why the ROCE has dropped. What's more, this can reduce some aspects of risk to the business because now the company's suppliers or short-term creditors are funding less of its operations. Since the business is basically funding more of its operations with it's own money, you could argue this has made the business less efficient at generating ROCE.
The Key Takeaway
Bringing it all together, while we're somewhat encouraged by Unimech Group Berhad's reinvestment in its own business, we're aware that returns are shrinking. Since the stock has gained an impressive 80% over the last five years, investors must think there's better things to come. But if the trajectory of these underlying trends continue, we think the likelihood of it being a multi-bagger from here isn't high.
If you want to continue researching Unimech Group Berhad, you might be interested to know about the 2 warning signs that our analysis has discovered.
For those who like to invest in solid companies, check out this free list of companies with solid balance sheets and high returns on equity.
Have feedback on this article? Concerned about the content? Get in touch with us directly. Alternatively, email editorial-team (at) simplywallst.com.
This article by Simply Wall St is general in nature. We provide commentary based on historical data and analyst forecasts only using an unbiased methodology and our articles are not intended to be financial advice. It does not constitute a recommendation to buy or sell any stock, and does not take account of your objectives, or your financial situation. We aim to bring you long-term focused analysis driven by fundamental data. Note that our analysis may not factor in the latest price-sensitive company announcements or qualitative material. Simply Wall St has no position in any stocks mentioned.
