
 Yahoo Finance
 Returns At Censof Holdings Berhad (KLSE:CENSOF) Are On The Way Up
If we want to find a potential multi-bagger, often there are underlying trends that can provide clues. Firstly, we'd want to identify a growing return on capital employed (ROCE) and then alongside that, an ever-increasing base of capital employed. Basically this means that a company has profitable initiatives that it can continue to reinvest in, which is a trait of a compounding machine. So on that note, Censof Holdings Berhad (KLSE:CENSOF) looks quite promising in regards to its trends of return on capital.
Understanding Return On Capital Employed (ROCE)
If you haven't worked with ROCE before, it measures the 'return' (pre-tax profit) a company generates from capital employed in its business. Analysts use this formula to calculate it for Censof Holdings Berhad:
Return on Capital Employed = Earnings Before Interest and Tax (EBIT) ÷ (Total Assets - Current Liabilities)
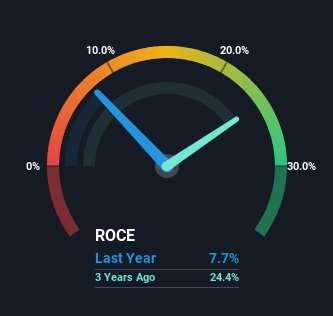
0.077 = RM8.0m ÷ (RM131m - RM28m) (Based on the trailing twelve months to December 2023).
Thus, Censof Holdings Berhad has an ROCE of 7.7%. On its own, that's a low figure but it's around the 9.0% average generated by the Software industry.
See our latest analysis for Censof Holdings Berhad
While the past is not representative of the future, it can be helpful to know how a company has performed historically, which is why we have this chart above. If you're interested in investigating Censof Holdings Berhad's past further, check out this free graph covering Censof Holdings Berhad's past earnings, revenue and cash flow.
The Trend Of ROCE
It's great to see that Censof Holdings Berhad has started to generate some pre-tax earnings from prior investments. The company was generating losses five years ago, but now it's turned around, earning 7.7% which is no doubt a relief for some early shareholders. At first glance, it seems the business is getting more proficient at generating returns, because over the same period, the amount of capital employed has reduced by 42%. This could potentially mean that the company is selling some of its assets.
For the record though, there was a noticeable increase in the company's current liabilities over the period, so we would attribute some of the ROCE growth to that. The current liabilities has increased to 21% of total assets, so the business is now more funded by the likes of its suppliers or short-term creditors. Keep an eye out for future increases because when the ratio of current liabilities to total assets gets particularly high, this can introduce some new risks for the business.
Our Take On Censof Holdings Berhad's ROCE
In the end, Censof Holdings Berhad has proven it's capital allocation skills are good with those higher returns from less amount of capital. And with a respectable 84% awarded to those who held the stock over the last five years, you could argue that these developments are starting to get the attention they deserve. So given the stock has proven it has promising trends, it's worth researching the company further to see if these trends are likely to persist.
On a final note, we've found 3 warning signs for Censof Holdings Berhad that we think you should be aware of.
If you want to search for solid companies with great earnings, check out this free list of companies with good balance sheets and impressive returns on equity.
Have feedback on this article? Concerned about the content? Get in touch with us directly. Alternatively, email editorial-team (at) simplywallst.com.
This article by Simply Wall St is general in nature. We provide commentary based on historical data and analyst forecasts only using an unbiased methodology and our articles are not intended to be financial advice. It does not constitute a recommendation to buy or sell any stock, and does not take account of your objectives, or your financial situation. We aim to bring you long-term focused analysis driven by fundamental data. Note that our analysis may not factor in the latest price-sensitive company announcements or qualitative material. Simply Wall St has no position in any stocks mentioned.
