
 Yahoo Finance
 Green Brick Partners (NYSE:GRBK) sheds 3.4% this week, as yearly returns fall more in line with earnings growth
For many, the main point of investing in the stock market is to achieve spectacular returns. And highest quality companies can see their share prices grow by huge amounts. To wit, the Green Brick Partners, Inc. (NYSE:GRBK) share price has soared 550% over five years. This just goes to show the value creation that some businesses can achieve. On top of that, the share price is up 17% in about a quarter. But this could be related to the strong market, which is up 10% in the last three months. Anyone who held for that rewarding ride would probably be keen to talk about it.
Although Green Brick Partners has shed US$91m from its market cap this week, let's take a look at its longer term fundamental trends and see if they've driven returns.
See our latest analysis for Green Brick Partners
There is no denying that markets are sometimes efficient, but prices do not always reflect underlying business performance. One way to examine how market sentiment has changed over time is to look at the interaction between a company's share price and its earnings per share (EPS).
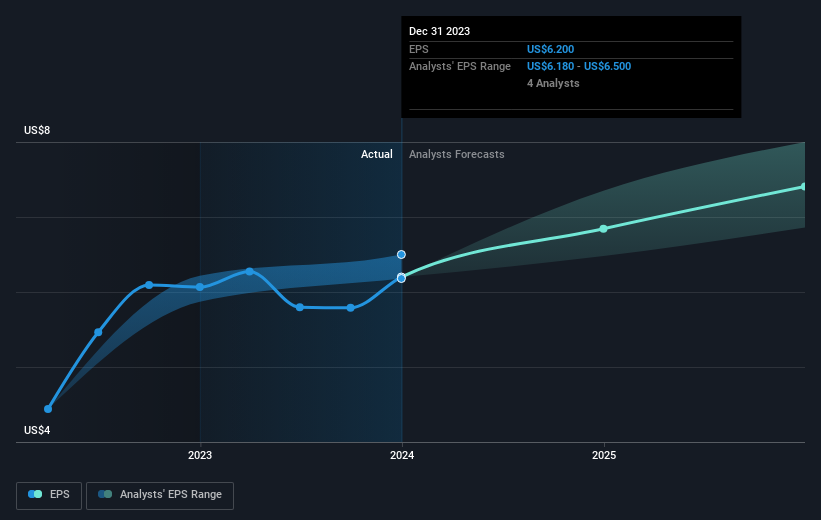
Over half a decade, Green Brick Partners managed to grow its earnings per share at 44% a year. That makes the EPS growth particularly close to the yearly share price growth of 45%. Therefore one could conclude that sentiment towards the shares hasn't morphed very much. Indeed, it would appear the share price is reacting to the EPS.
You can see below how EPS has changed over time (discover the exact values by clicking on the image).
It's good to see that there was some significant insider buying in the last three months. That's a positive. On the other hand, we think the revenue and earnings trends are much more meaningful measures of the business. Dive deeper into the earnings by checking this interactive graph of Green Brick Partners' earnings, revenue and cash flow.
A Different Perspective
It's good to see that Green Brick Partners has rewarded shareholders with a total shareholder return of 77% in the last twelve months. That's better than the annualised return of 45% over half a decade, implying that the company is doing better recently. In the best case scenario, this may hint at some real business momentum, implying that now could be a great time to delve deeper. Investors who like to make money usually check up on insider purchases, such as the price paid, and total amount bought. You can find out about the insider purchases of Green Brick Partners by clicking this link.
Green Brick Partners is not the only stock that insiders are buying. For those who like to find winning investments this free list of growing companies with recent insider purchasing, could be just the ticket.
Please note, the market returns quoted in this article reflect the market weighted average returns of stocks that currently trade on American exchanges.
Have feedback on this article? Concerned about the content? Get in touch with us directly. Alternatively, email editorial-team (at) simplywallst.com.
This article by Simply Wall St is general in nature. We provide commentary based on historical data and analyst forecasts only using an unbiased methodology and our articles are not intended to be financial advice. It does not constitute a recommendation to buy or sell any stock, and does not take account of your objectives, or your financial situation. We aim to bring you long-term focused analysis driven by fundamental data. Note that our analysis may not factor in the latest price-sensitive company announcements or qualitative material. Simply Wall St has no position in any stocks mentioned.
