
Those Who Invested in Freedom Holding (NASDAQ:FRHC) Five Years Ago Are up 746%
Those Who Invested in Freedom Holding (NASDAQ:FRHC) Five Years Ago Are up 746%
It hasn't been the best quarter for Freedom Holding Corp. (NASDAQ:FRHC) shareholders, since the share price has fallen 13% in that time. But that doesn't change the fact that the returns over the last half decade have been spectacular. In fact, during that period, the share price climbed 746%. Impressive! Arguably, the recent fall is to be expected after such a strong rise. The most important thing for savvy investors to consider is whether the underlying business can justify the share price gain. Anyone who held for that rewarding ride would probably be keen to talk about it.
對於自由控股公司(納斯達克股票代碼:FRHC)股東來說,這並不是最好的季度,因爲當時股價已經下跌了13%。但這並不能改變過去五年來回報驚人的事實。實際上,在此期間,股價上漲了746%。印象深刻!可以說,在經歷瞭如此強勁的上漲之後,最近的下跌是可以預料的。對於精明的投資者來說,最重要的事情是標的業務能否證明股價上漲是合理的。任何爲那次獎勵之旅堅持下去的人都可能熱衷於談論這件事。
So let's investigate and see if the longer term performance of the company has been in line with the underlying business' progress.
因此,讓我們調查一下,看看公司的長期表現是否與基礎業務的進展一致。
While markets are a powerful pricing mechanism, share prices reflect investor sentiment, not just underlying business performance. One way to examine how market sentiment has changed over time is to look at the interaction between a company's share price and its earnings per share (EPS).
雖然市場是一種強大的定價機制,但股價反映了投資者的情緒,而不僅僅是潛在的業務表現。研究市場情緒如何隨着時間的推移而變化的一種方法是研究公司股價與其每股收益(EPS)之間的相互作用。
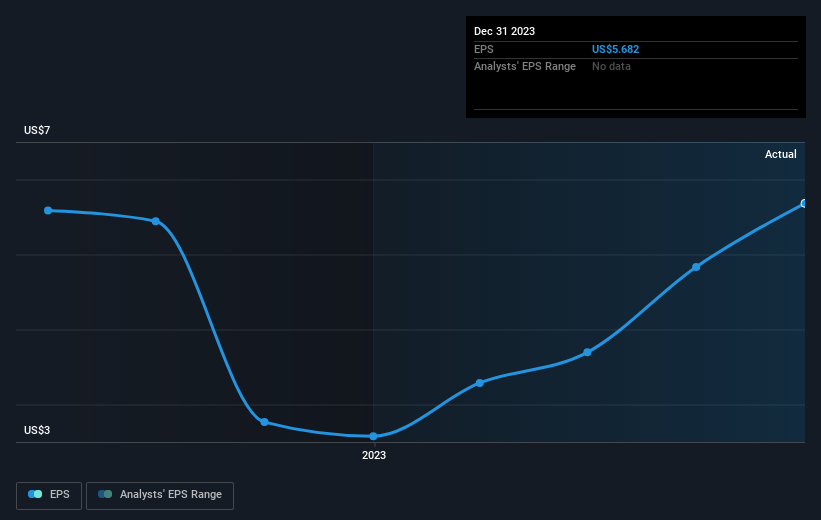
Over half a decade, Freedom Holding managed to grow its earnings per share at 258% a year. This EPS growth is higher than the 53% average annual increase in the share price. Therefore, it seems the market has become relatively pessimistic about the company.
在過去的五年中,自由控股設法將其每股收益增長到每年258%。每股收益的增長高於股價年均增長53%。因此,市場似乎對該公司變得相對悲觀。
The graphic below depicts how EPS has changed over time (unveil the exact values by clicking on the image).
下圖描述了 EPS 隨着時間的推移是如何變化的(點擊圖片可以看到確切的值)。
We're pleased to report that the CEO is remunerated more modestly than most CEOs at similarly capitalized companies. It's always worth keeping an eye on CEO pay, but a more important question is whether the company will grow earnings throughout the years. This free interactive report on Freedom Holding's earnings, revenue and cash flow is a great place to start, if you want to investigate the stock further.
我們很高興地向大家報告,首席執行官的薪酬比資本相似公司的大多數首席執行官要適中。始終值得關注首席執行官的薪酬,但更重要的問題是公司多年來是否會增加收益。如果你想進一步調查該股,這份關於Freedom Holding收益、收入和現金流的免費互動報告是一個很好的起點。
A Different Perspective
不同的視角
Freedom Holding shareholders are down 3.8% for the year, but the market itself is up 28%. However, keep in mind that even the best stocks will sometimes underperform the market over a twelve month period. Longer term investors wouldn't be so upset, since they would have made 53%, each year, over five years. It could be that the recent sell-off is an opportunity, so it may be worth checking the fundamental data for signs of a long term growth trend. If you would like to research Freedom Holding in more detail then you might want to take a look at whether insiders have been buying or selling shares in the company.
自由控股股東今年下跌了3.8%,但市場本身上漲了28%。但是,請記住,即使是最好的股票有時也會在十二個月內表現不如市場。長期投資者不會那麼沮喪,因爲他們將在五年內每年賺取53%的收入。最近的拋售可能是一個機會,因此可能值得查看基本面數據以尋找長期增長趨勢的跡象。如果你想更詳細地研究Freedom Holding的股票,那麼你可能需要看看內部人士是否在買入或賣出該公司的股票。
Of course, you might find a fantastic investment by looking elsewhere. So take a peek at this free list of companies we expect will grow earnings.
當然,通過尋找其他地方,你可能會找到一筆不錯的投資。因此,請看一下我們預計收益將增加的這份免費公司名單。
Please note, the market returns quoted in this article reflect the market weighted average returns of stocks that currently trade on American exchanges.
請注意,本文引用的市場回報反映了目前在美國交易所交易的股票的市場加權平均回報。
Have feedback on this article? Concerned about the content? Get in touch with us directly. Alternatively, email editorial-team (at) simplywallst.com.
This article by Simply Wall St is general in nature. We provide commentary based on historical data and analyst forecasts only using an unbiased methodology and our articles are not intended to be financial advice. It does not constitute a recommendation to buy or sell any stock, and does not take account of your objectives, or your financial situation. We aim to bring you long-term focused analysis driven by fundamental data. Note that our analysis may not factor in the latest price-sensitive company announcements or qualitative material. Simply Wall St has no position in any stocks mentioned.
對這篇文章有反饋嗎?對內容感到擔憂?直接聯繫我們。 或者,給編輯團隊 (at) simplywallst.com 發送電子郵件。
Simply Wall St的這篇文章本質上是籠統的。我們僅使用公正的方法根據歷史數據和分析師的預測提供評論,我們的文章無意作爲財務建議。它不構成買入或賣出任何股票的建議,也沒有考慮到您的目標或財務狀況。我們的目標是爲您提供由基本數據驅動的長期重點分析。請注意,我們的分析可能不考慮最新的價格敏感型公司公告或定性材料。簡而言之,華爾街沒有持有任何上述股票的頭寸。
譯文內容由第三人軟體翻譯。