
Returns On Capital Signal Difficult Times Ahead For Hla Group (SHSE:600398)
Returns On Capital Signal Difficult Times Ahead For Hla Group (SHSE:600398)
When we're researching a company, it's sometimes hard to find the warning signs, but there are some financial metrics that can help spot trouble early. When we see a declining return on capital employed (ROCE) in conjunction with a declining base of capital employed, that's often how a mature business shows signs of aging. This indicates to us that the business is not only shrinking the size of its net assets, but its returns are falling as well. On that note, looking into Hla Group (SHSE:600398), we weren't too upbeat about how things were going.
當我們研究一家公司時,有時很難找到警告信號,但是有一些財務指標可以幫助及早發現問題。當我們看到下降時 返回 在資本使用率(ROCE)的下降的同時 基礎 就所使用的資本而言,成熟的企業通常會以這種方式顯示出老化的跡象。這向我們表明,該企業不僅在縮小其淨資產規模,而且其回報率也在下降。值得注意的是,調查Hla集團(SHSE: 600398),我們對事情的發展並不太樂觀。
Understanding Return On Capital Employed (ROCE)
了解資本使用回報率 (ROCE)
For those that aren't sure what ROCE is, it measures the amount of pre-tax profits a company can generate from the capital employed in its business. Analysts use this formula to calculate it for Hla Group:
對於那些不確定ROCE是什麼的人,它衡量的是公司從其業務中使用的資本中可以產生的稅前利潤金額。分析師使用以下公式來計算 Hla Group 的利潤:
Return on Capital Employed = Earnings Before Interest and Tax (EBIT) ÷ (Total Assets - Current Liabilities)
已動用資本回報率 = 息稅前收益 (EBIT) ¥(總資產-流動負債)
0.18 = CN¥3.4b ÷ (CN¥30b - CN¥12b) (Based on the trailing twelve months to September 2023).
0.18 = 3.4億元人民幣 ÷(30億元人民幣-12億元人民幣) (基於截至2023年9月的過去十二個月)。
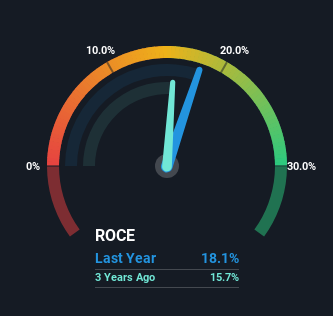
Thus, Hla Group has an ROCE of 18%. In absolute terms, that's a satisfactory return, but compared to the Specialty Retail industry average of 5.2% it's much better.
因此,Hla集團的投資回報率爲18%。從絕對值來看,這是一個令人滿意的回報,但與專業零售行業的平均水平5.2%相比,回報要好得多。
In the above chart we have measured Hla Group's prior ROCE against its prior performance, but the future is arguably more important. If you'd like to see what analysts are forecasting going forward, you should check out our free analyst report for Hla Group .
在上圖中,我們將Hla集團先前的投資回報率與之前的表現進行了比較,但可以說,未來更爲重要。如果你想了解分析師對未來的預測,你應該查看我們爲Hla Group提供的免費分析師報告。
The Trend Of ROCE
ROCE 的趨勢
There is reason to be cautious about Hla Group, given the returns are trending downwards. To be more specific, the ROCE was 28% five years ago, but since then it has dropped noticeably. And on the capital employed front, the business is utilizing roughly the same amount of capital as it was back then. Since returns are falling and the business has the same amount of assets employed, this can suggest it's a mature business that hasn't had much growth in the last five years. If these trends continue, we wouldn't expect Hla Group to turn into a multi-bagger.
鑑於回報率呈下降趨勢,有理由對Hla集團持謹慎態度。更具體地說,五年前的投資回報率爲28%,但此後已明顯下降。在資本使用方面,該企業使用的資本量與當時大致相同。由於回報率下降且該企業的資產數量相同,這可能表明它是一家成熟的企業,在過去五年中沒有太大的增長。如果這些趨勢繼續下去,我們預計Hla集團不會變成一個多袋公司。
Our Take On Hla Group's ROCE
我們對 Hla 集團投資回報率的看法
In the end, the trend of lower returns on the same amount of capital isn't typically an indication that we're looking at a growth stock. Investors must expect better things on the horizon though because the stock has risen 18% in the last five years. Regardless, we don't like the trends as they are and if they persist, we think you might find better investments elsewhere.
歸根結底,相同數量的資本回報率下降的趨勢通常並不表示我們正在考慮成長型股票。但是,投資者必須期待更好的局面,因爲該股在過去五年中上漲了18%。無論如何,我們不喜歡這種趨勢的現狀,如果趨勢持續下去,我們認爲您可能會在其他地方找到更好的投資。
One more thing, we've spotted 2 warning signs facing Hla Group that you might find interesting.
還有一件事,我們發現了Hla集團面臨的兩個警告信號,你可能會覺得有趣。
While Hla Group may not currently earn the highest returns, we've compiled a list of companies that currently earn more than 25% return on equity. Check out this free list here.
儘管Hla集團目前可能無法獲得最高的回報,但我們編制了一份目前股本回報率超過25%的公司名單。在這裏查看這個免費清單。
Have feedback on this article? Concerned about the content? Get in touch with us directly. Alternatively, email editorial-team (at) simplywallst.com.
This article by Simply Wall St is general in nature. We provide commentary based on historical data and analyst forecasts only using an unbiased methodology and our articles are not intended to be financial advice. It does not constitute a recommendation to buy or sell any stock, and does not take account of your objectives, or your financial situation. We aim to bring you long-term focused analysis driven by fundamental data. Note that our analysis may not factor in the latest price-sensitive company announcements or qualitative material. Simply Wall St has no position in any stocks mentioned.
對這篇文章有反饋嗎?對內容感到擔憂?直接聯繫我們。 或者,給編輯團隊 (at) simplywallst.com 發送電子郵件。
Simply Wall St的這篇文章本質上是籠統的。我們僅使用公正的方法根據歷史數據和分析師的預測提供評論,我們的文章無意作爲財務建議。它不構成買入或賣出任何股票的建議,也沒有考慮到您的目標或財務狀況。我們的目標是爲您提供由基本數據驅動的長期重點分析。請注意,我們的分析可能不考慮最新的價格敏感型公司公告或定性材料。簡而言之,華爾街沒有持有任何上述股票的頭寸。
譯文內容由第三人軟體翻譯。