
Sanmina's (NASDAQ:SANM) Five-year Earnings Growth Trails the 15% YoY Shareholder Returns
Sanmina's (NASDAQ:SANM) Five-year Earnings Growth Trails the 15% YoY Shareholder Returns
When we invest, we're generally looking for stocks that outperform the market average. And while active stock picking involves risks (and requires diversification) it can also provide excess returns. To wit, the Sanmina share price has climbed 100% in five years, easily topping the market return of 74% (ignoring dividends). However, more recent returns haven't been as impressive as that, with the stock returning just 3.6% in the last year.
當我們投資時,我們通常是在尋找表現超過市場平均水平的股票。而且,儘管主動選股涉及風險(並且需要分散投資),但它也可以提供超額回報。換句話說,Sanmina的股價在五年內上漲了100%,輕鬆超過了74%的市場回報率(不計股息)。但是,最近的回報並不那麼令人印象深刻,該股去年的回報率僅爲3.6%。
The past week has proven to be lucrative for Sanmina investors, so let's see if fundamentals drove the company's five-year performance.
事實證明,過去一週對Sanmina的投資者來說是有利可圖的,所以讓我們看看基本面是否推動了公司的五年業績。
While markets are a powerful pricing mechanism, share prices reflect investor sentiment, not just underlying business performance. One flawed but reasonable way to assess how sentiment around a company has changed is to compare the earnings per share (EPS) with the share price.
雖然市場是一種強大的定價機制,但股價反映了投資者的情緒,而不僅僅是潛在的業務表現。評估公司情緒變化的一種有缺陷但合理的方法是將每股收益(EPS)與股價進行比較。
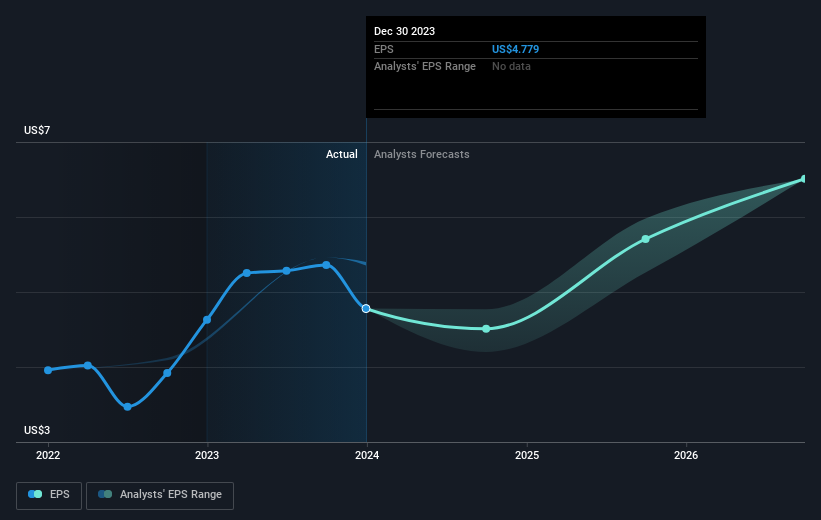
During five years of share price growth, Sanmina achieved compound earnings per share (EPS) growth of 28% per year. The EPS growth is more impressive than the yearly share price gain of 15% over the same period. So it seems the market isn't so enthusiastic about the stock these days.
在五年的股價增長中,Sanmina實現了每年28%的複合每股收益(EPS)增長。每股收益的增長比同期15%的年股價增長更令人印象深刻。因此,如今市場似乎對該股並不那麼熱情。
The graphic below depicts how EPS has changed over time (unveil the exact values by clicking on the image).
下圖描述了 EPS 隨着時間的推移是如何變化的(點擊圖片可以看到確切的值)。
We know that Sanmina has improved its bottom line over the last three years, but what does the future have in store? Take a more thorough look at Sanmina's financial health with this free report on its balance sheet.
我們知道Sanmina在過去三年中提高了利潤,但是未來會怎樣?通過這份免費的資產負債表報告,更全面地了解Sanmina的財務狀況。
A Different Perspective
不同的視角
Sanmina provided a TSR of 3.6% over the last twelve months. But that return falls short of the market. If we look back over five years, the returns are even better, coming in at 15% per year for five years. Maybe the share price is just taking a breather while the business executes on its growth strategy. While it is well worth considering the different impacts that market conditions can have on the share price, there are other factors that are even more important. Case in point: We've spotted 1 warning sign for Sanmina you should be aware of.
在過去的十二個月中,Sanmina的股東回報率爲3.6%。但是這種回報不及市場。如果我們回顧五年,回報率甚至更高,五年內每年爲15%。也許在企業執行增長戰略的同時,股價只是在稍作休息。儘管市場狀況可能對股價產生的不同影響值得考慮,但還有其他因素更爲重要。一個很好的例子:我們發現了你應該注意的Sanmina的1個警告標誌。
If you would prefer to check out another company -- one with potentially superior financials -- then do not miss this free list of companies that have proven they can grow earnings.
如果你想看看另一家公司——一家財務狀況可能優異的公司——那麼千萬不要錯過這份已經證明自己可以增加收益的公司的免費名單。
Please note, the market returns quoted in this article reflect the market weighted average returns of stocks that currently trade on American exchanges.
請注意,本文引用的市場回報反映了目前在美國交易所交易的股票的市場加權平均回報。
Have feedback on this article? Concerned about the content? Get in touch with us directly. Alternatively, email editorial-team (at) simplywallst.com.
This article by Simply Wall St is general in nature. We provide commentary based on historical data and analyst forecasts only using an unbiased methodology and our articles are not intended to be financial advice. It does not constitute a recommendation to buy or sell any stock, and does not take account of your objectives, or your financial situation. We aim to bring you long-term focused analysis driven by fundamental data. Note that our analysis may not factor in the latest price-sensitive company announcements or qualitative material. Simply Wall St has no position in any stocks mentioned.
對這篇文章有反饋嗎?對內容感到擔憂?直接聯繫我們。 或者,給編輯團隊 (at) simplywallst.com 發送電子郵件。
Simply Wall St的這篇文章本質上是籠統的。我們僅使用公正的方法根據歷史數據和分析師的預測提供評論,我們的文章無意作爲財務建議。它不構成買入或賣出任何股票的建議,也沒有考慮到您的目標或財務狀況。我們的目標是爲您提供由基本數據驅動的長期重點分析。請注意,我們的分析可能不考慮最新的價格敏感型公司公告或定性材料。簡而言之,華爾街沒有持有任何上述股票的頭寸。
譯文內容由第三人軟體翻譯。