
 Yahoo Finance
 Cepton Full Year 2023 Earnings: Beats Expectations
Cepton (NASDAQ:CPTN) Full Year 2023 Results
Key Financial Results
Revenue: US$13.1m (up 76% from FY 2022).
Net loss: US$48.5m (down from US$9.38m profit in FY 2022).
US$3.08 loss per share (down from US$0.64 profit in FY 2022).
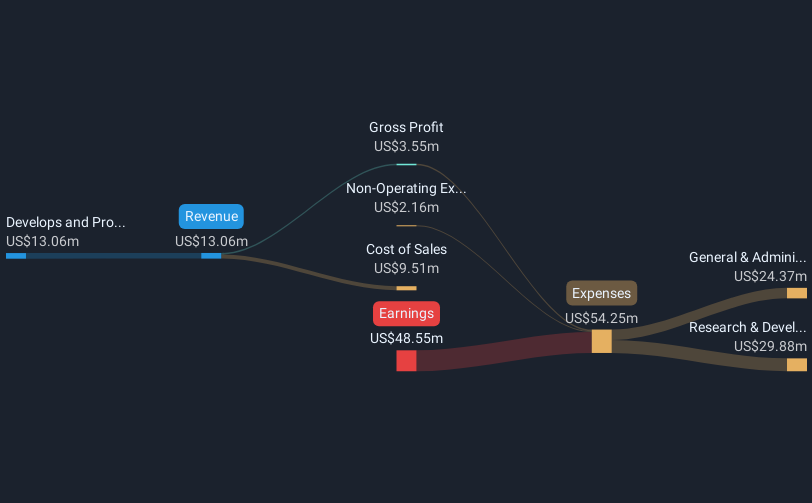
All figures shown in the chart above are for the trailing 12 month (TTM) period
Cepton Revenues and Earnings Beat Expectations
Revenue exceeded analyst estimates by 24%. Earnings per share (EPS) also surpassed analyst estimates by 2.6%.
In the last 12 months, the only revenue segment was Develops and Produces Lidar Sensors contributing US$13.1m. Notably, cost of sales worth US$9.51m amounted to 73% of total revenue thereby underscoring the impact on earnings. The largest operating expense was Research & Development (R&D) costs, amounting to US$29.9m (55% of total expenses). Over the last 12 months, the company's earnings were enhanced by non-operating gains of US$2.16m. Explore how CPTN's revenue and expenses shape its earnings.
Looking ahead, revenue is forecast to grow 45% p.a. on average during the next 3 years, compared to a 5.4% growth forecast for the Electronic industry in the US.
Performance of the American Electronic industry.
The company's shares are up 5.7% from a week ago.
Risk Analysis
What about risks? Every company has them, and we've spotted 1 warning sign for Cepton you should know about.
Have feedback on this article? Concerned about the content? Get in touch with us directly. Alternatively, email editorial-team (at) simplywallst.com.
This article by Simply Wall St is general in nature. We provide commentary based on historical data and analyst forecasts only using an unbiased methodology and our articles are not intended to be financial advice. It does not constitute a recommendation to buy or sell any stock, and does not take account of your objectives, or your financial situation. We aim to bring you long-term focused analysis driven by fundamental data. Note that our analysis may not factor in the latest price-sensitive company announcements or qualitative material. Simply Wall St has no position in any stocks mentioned.
