
John Wiley & Sons (NYSE:WLY) Has More To Do To Multiply In Value Going Forward
John Wiley & Sons (NYSE:WLY) Has More To Do To Multiply In Value Going Forward
If we want to find a potential multi-bagger, often there are underlying trends that can provide clues. Typically, we'll want to notice a trend of growing return on capital employed (ROCE) and alongside that, an expanding base of capital employed. Put simply, these types of businesses are compounding machines, meaning they are continually reinvesting their earnings at ever-higher rates of return. However, after briefly looking over the numbers, we don't think John Wiley & Sons (NYSE:WLY) has the makings of a multi-bagger going forward, but let's have a look at why that may be.
如果我們想找到潛在的多袋裝袋機,通常有一些潛在的趨勢可以提供線索。通常,我們希望注意到增長的趨勢 返回 在資本使用率(ROCE)方面,除此之外,還在擴大 基礎 所用資本的比例。簡而言之,這些類型的企業是複合機器,這意味着他們不斷以更高的回報率對收益進行再投資。但是,在簡短地查看了這些數字之後,我們認爲John Wiley & Sons(紐約證券交易所代碼:WLY)未來不具備多袋裝箱的實力,但讓我們來看看爲什麼會這樣。
Understanding Return On Capital Employed (ROCE)
了解資本使用回報率 (ROCE)
Just to clarify if you're unsure, ROCE is a metric for evaluating how much pre-tax income (in percentage terms) a company earns on the capital invested in its business. To calculate this metric for John Wiley & Sons, this is the formula:
爲了澄清一下你是否不確定,ROCE是評估公司從投資於其業務的資本中獲得多少稅前收入(按百分比計算)的指標。要計算 John Wiley & Sons 的這個指標,公式如下:
Return on Capital Employed = Earnings Before Interest and Tax (EBIT) ÷ (Total Assets - Current Liabilities)
已動用資本回報率 = 息稅前收益 (EBIT) ¥(總資產-流動負債)
0.11 = US$229m ÷ (US$2.7b - US$712m) (Based on the trailing twelve months to January 2024).
0.11 = 2.29億美元 ÷(27億美元-7.12億美元) (基於截至2024年1月的過去十二個月)。
Therefore, John Wiley & Sons has an ROCE of 11%. In absolute terms, that's a satisfactory return, but compared to the Media industry average of 8.3% it's much better.
因此,John Wiley & Sons的投資回報率爲11%。從絕對值來看,這是一個令人滿意的回報,但與媒體行業的平均水平8.3%相比,回報要好得多。
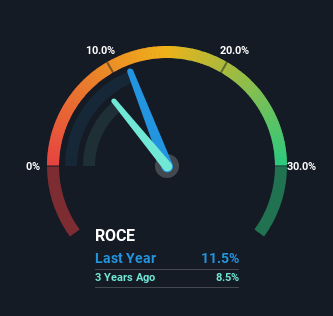
In the above chart we have measured John Wiley & Sons' prior ROCE against its prior performance, but the future is arguably more important. If you'd like to see what analysts are forecasting going forward, you should check out our free analyst report for John Wiley & Sons .
在上圖中,我們將John Wiley & Sons之前的投資回報率與之前的表現進行了比較,但可以說,未來更爲重要。如果你想了解分析師對未來的預測,你應該查看我們爲John Wiley & Sons提供的免費分析師報告。
The Trend Of ROCE
ROCE 的趨勢
Things have been pretty stable at John Wiley & Sons, with its capital employed and returns on that capital staying somewhat the same for the last five years. This tells us the company isn't reinvesting in itself, so it's plausible that it's past the growth phase. So unless we see a substantial change at John Wiley & Sons in terms of ROCE and additional investments being made, we wouldn't hold our breath on it being a multi-bagger.
John Wiley & Sons的情況一直相當穩定,在過去五年中,其資本使用率和資本回報率基本保持不變。這告訴我們該公司沒有對自己進行再投資,因此它已經過了增長階段是合理的。因此,除非我們看到John Wiley & Sons在投資回報率方面發生重大變化並進行額外投資,否則我們不會對它成爲一家多口袋公司屏住呼吸。
The Bottom Line On John Wiley & Sons' ROCE
John Wiley & Sons 的 ROCE 的底線
In a nutshell, John Wiley & Sons has been trudging along with the same returns from the same amount of capital over the last five years. Additionally, the stock's total return to shareholders over the last five years has been flat, which isn't too surprising. All in all, the inherent trends aren't typical of multi-baggers, so if that's what you're after, we think you might have more luck elsewhere.
簡而言之,在過去的五年中,John Wiley & Sons一直在努力從相同數量的資本中獲得相同的回報。此外,該股在過去五年中的股東總回報率一直持平,這並不奇怪。總而言之,多裝袋機的固有趨勢並不常見,因此,如果您想要這樣做,我們認爲您在其他地方可能會有更多的運氣。
If you'd like to know about the risks facing John Wiley & Sons, we've discovered 2 warning signs that you should be aware of.
如果你想了解John Wiley & Sons面臨的風險,我們發現了兩個警告信號,你應該注意。
While John Wiley & Sons isn't earning the highest return, check out this free list of companies that are earning high returns on equity with solid balance sheets.
儘管John Wiley & Sons的回報率並不高,但請查看這份免費的股票回報率高、資產負債表穩健的公司名單。
Have feedback on this article? Concerned about the content? Get in touch with us directly. Alternatively, email editorial-team (at) simplywallst.com.
This article by Simply Wall St is general in nature. We provide commentary based on historical data and analyst forecasts only using an unbiased methodology and our articles are not intended to be financial advice. It does not constitute a recommendation to buy or sell any stock, and does not take account of your objectives, or your financial situation. We aim to bring you long-term focused analysis driven by fundamental data. Note that our analysis may not factor in the latest price-sensitive company announcements or qualitative material. Simply Wall St has no position in any stocks mentioned.
對這篇文章有反饋嗎?對內容感到擔憂?直接聯繫我們。 或者,給編輯團隊 (at) simplywallst.com 發送電子郵件。
Simply Wall St的這篇文章本質上是籠統的。我們僅使用公正的方法根據歷史數據和分析師的預測提供評論,我們的文章無意作爲財務建議。它不構成買入或賣出任何股票的建議,也沒有考慮到您的目標或財務狀況。我們的目標是爲您提供由基本數據驅動的長期重點分析。請注意,我們的分析可能不考慮最新的價格敏感型公司公告或定性材料。簡而言之,華爾街沒有持有任何上述股票的頭寸。
譯文內容由第三人軟體翻譯。