
Goldman Sachs Gr Options Trading: A Deep Dive Into Market Sentiment
Goldman Sachs Gr Options Trading: A Deep Dive Into Market Sentiment
Financial giants have made a conspicuous bearish move on Goldman Sachs Gr. Our analysis of options history for Goldman Sachs Gr (NYSE:GS) revealed 33 unusual trades.
Delving into the details, we found 48% of traders were bullish, while 51% showed bearish tendencies. Out of all the trades we spotted, 10 were puts, with a value of $1,080,375, and 23 were calls, valued at $1,068,999.
Projected Price Targets
Taking into account the Volume and Open Interest on these contracts, it appears that whales have been targeting a price range from $290.0 to $435.0 for Goldman Sachs Gr over the last 3 months.
Volume & Open Interest Trends
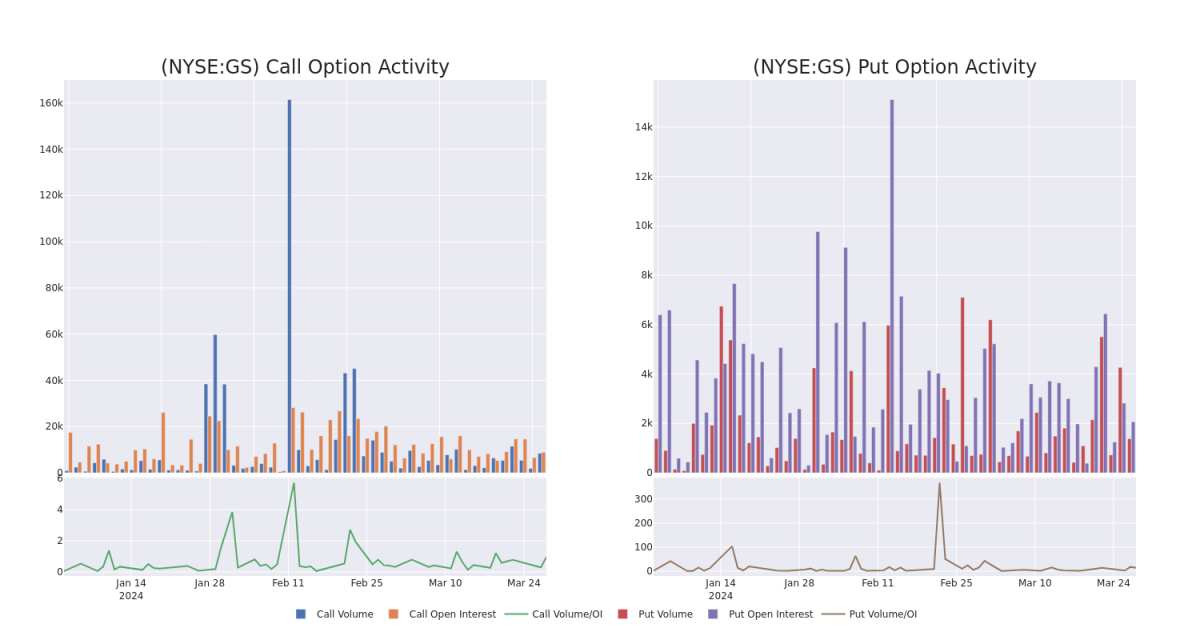
Assessing the volume and open interest is a strategic step in options trading. These metrics shed light on the liquidity and investor interest in Goldman Sachs Gr's options at specified strike prices. The forthcoming data visualizes the fluctuation in volume and open interest for both calls and puts, linked to Goldman Sachs Gr's substantial trades, within a strike price spectrum from $290.0 to $435.0 over the preceding 30 days.
Goldman Sachs Gr Option Activity Analysis: Last 30 Days
Noteworthy Options Activity:
| Symbol | PUT/CALL | Trade Type | Sentiment | Exp. Date | Ask | Bid | Price | Strike Price | Total Trade Price | Open Interest | Volume |
|---|---|---|---|---|---|---|---|---|---|---|---|
| GS | PUT | TRADE | BULLISH | 11/15/24 | $24.5 | $24.25 | $24.35 | $410.00 | $487.0K | 147 | 202 |
| GS | PUT | TRADE | BULLISH | 01/17/25 | $21.85 | $21.55 | $21.58 | $390.00 | $129.4K | 1.2K | 60 |
| GS | PUT | SWEEP | BEARISH | 05/17/24 | $9.85 | $9.65 | $9.75 | $410.00 | $115.0K | 265 | 271 |
| GS | PUT | SWEEP | BEARISH | 05/17/24 | $9.55 | $9.5 | $9.55 | $410.00 | $95.5K | 265 | 613 |
| GS | CALL | SWEEP | BULLISH | 04/19/24 | $4.7 | $4.55 | $4.66 | $430.00 | $93.9K | 1.3K | 442 |
About Goldman Sachs Gr
Goldman Sachs is a leading global investment banking and asset management firm. Approximately 20% of its revenue comes from investment banking, 45% from trading, 20% from asset management and 15% from wealth management and retail financial services. Around 60% of the company's net revenue is generated in the Americas, 15% in Asia, and 25% in Europe, the Middle East, and Africa.
Having examined the options trading patterns of Goldman Sachs Gr, our attention now turns directly to the company. This shift allows us to delve into its present market position and performance
Present Market Standing of Goldman Sachs Gr
- With a trading volume of 1,089,354, the price of GS is up by 0.36%, reaching $416.75.
- Current RSI values indicate that the stock is may be approaching overbought.
- Next earnings report is scheduled for 18 days from now.
Professional Analyst Ratings for Goldman Sachs Gr
A total of 5 professional analysts have given their take on this stock in the last 30 days, setting an average price target of $430.0.
- Showing optimism, an analyst from Daiwa Capital upgrades its rating to Outperform with a revised price target of $430.
- An analyst from JP Morgan has decided to maintain their Overweight rating on Goldman Sachs Gr, which currently sits at a price target of $424.
- In a cautious move, an analyst from RBC Capital downgraded its rating to Sector Perform, setting a price target of $390.
- Maintaining their stance, an analyst from Oppenheimer continues to hold a Outperform rating for Goldman Sachs Gr, targeting a price of $446.
- An analyst from HSBC persists with their Buy rating on Goldman Sachs Gr, maintaining a target price of $460.
Options are a riskier asset compared to just trading the stock, but they have higher profit potential. Serious options traders manage this risk by educating themselves daily, scaling in and out of trades, following more than one indicator, and following the markets closely.
金融巨頭對高盛集團採取了明顯的看跌舉動。我們對高盛集團(紐約證券交易所代碼:GS)期權歷史的分析顯示了33筆不尋常的交易。
深入研究細節,我們發現48%的交易者看漲,而51%的交易者表現出看跌趨勢。在我們發現的所有交易中,有10筆是看跌期權,價值爲1,080,375美元,23筆是看漲期權,價值爲1,068,999美元。
預計價格目標
考慮到這些合約的交易量和未平倉合約,在過去的3個月中,鯨魚似乎一直將高盛集團的價格定在290.0美元至435.0美元之間。
交易量和未平倉合約趨勢
評估交易量和未平倉合約是期權交易的戰略步驟。這些指標揭示了高盛集團按指定行使價計算的期權的流動性和投資者對該期權的興趣。即將發佈的數據可視化了與高盛集團的大量交易相關的看漲期權和未平倉合約的波動,在過去30天行使價範圍內,從290.0美元到435.0美元不等。
高盛 Gr 期權活動分析:過去 30 天
值得注意的期權活動:
符號 | 看跌/看漲 | 交易類型 | 情緒 | Exp。日期 | 問 | 出價 | 價格 | 行使價 | 總交易價格 | 未平倉合約 | 音量 |
|---|---|---|---|---|---|---|---|---|---|---|---|
GS | 放 | 貿易 | 看漲 | 11/15/24 | 24.5 美元 | 24.25 美元 | 24.35 | 410.00 美元 | 487.0 萬美元 | 147 | 202 |
GS | 放 | 貿易 | 看漲 | 01/17/25 | 21.85 美元 | 21.55 美元 | 21.58 美元 | 390.00 美元 | 129.4 萬美元 | 1.2K | 60 |
GS | 放 | 掃 | 看跌 | 05/17/24 | 9.85 美元 | 9.65 美元 | 9.75 美元 | 410.00 美元 | 115.0 萬美元 | 265 | 271 |
GS | 放 | 掃 | 看跌 | 05/17/24 | 9.55 美元 | 9.5 美元 | 9.55 美元 | 410.00 美元 | 95.5 萬美元 | 265 | 613 |
GS | 打電話 | 掃 | 看漲 | 04/19/24 | 4.7 美元 | 4.55 美元 | 4.66 美元 | 430.00 美元 | 93.9 萬美元 | 1.3K | 442 |
關於高盛集團
高盛是一家領先的全球投資銀行和資產管理公司。其收入中約有20%來自投資銀行,45%來自交易,20%來自資產管理,15%來自财富管理和零售金融服務。該公司約60%的淨收入來自美洲,15%來自亞洲,25%來自歐洲、中東和非洲。
在研究了高盛集團的期權交易模式之後,我們的注意力現在直接轉向了該公司。這種轉變使我們能夠深入研究其目前的市場地位和表現
高盛集團目前的市場地位
GS的交易量爲1,089,354美元,上漲了0.36%,達到416.75美元。
當前的RSI值表明該股可能已接近超買。
下一份收益報告定於即日起18天后發佈。
高盛集團的專業分析師評級
在過去的30天中,共有5位專業分析師對該股發表了看法,將平均目標股價定爲430.0美元。
大和資本的一位分析師表現出樂觀的態度,將其評級上調至跑贏大盤,目標股價爲430美元。
摩根大通的一位分析師已決定維持對高盛集團的增持評級,目前的目標股價爲424美元。
加拿大皇家銀行資本的一位分析師謹慎地將其評級下調至行業績效,將目標股價定爲390美元。
奧本海默的一位分析師保持立場,繼續維持高盛集團跑贏大盤的評級,目標股價爲446美元。
匯豐銀行的一位分析師堅持對高盛集團的買入評級,維持460美元的目標價。
與僅交易股票相比,期權是一種風險更高的資產,但它們具有更高的獲利潛力。嚴肅的期權交易者通過每天自我教育、擴大交易規模、關注多個指標以及密切關注市場來管理這種風險。
譯文內容由第三人軟體翻譯。
風險及免責聲明
- 分享到weixin
- 分享到qq
- 分享到facebook
- 分享到twitter
- 分享到微博
- 粘贴板
使用瀏覽器的分享功能,分享給你的好友吧