
 Yahoo Finance
 Hypera SA's Dividend Analysis
Understanding the Latest Dividend Declaration from Hypera SA
Hypera SA (HYPMY) recently announced a dividend of $0.02 per share, payable on a date yet to be confirmed, with the ex-dividend date set for 2024-03-22. As investors look forward to this upcoming payment, the spotlight also shines on the company's dividend history, yield, and growth rates. Using the data from GuruFocus, let's look into Hypera SA's dividend performance and assess its sustainability.
What Does Hypera SA Do?
This Powerful Chart Made Peter Lynch 29% A Year For 13 Years
How to calculate the intrinsic value of a stock?
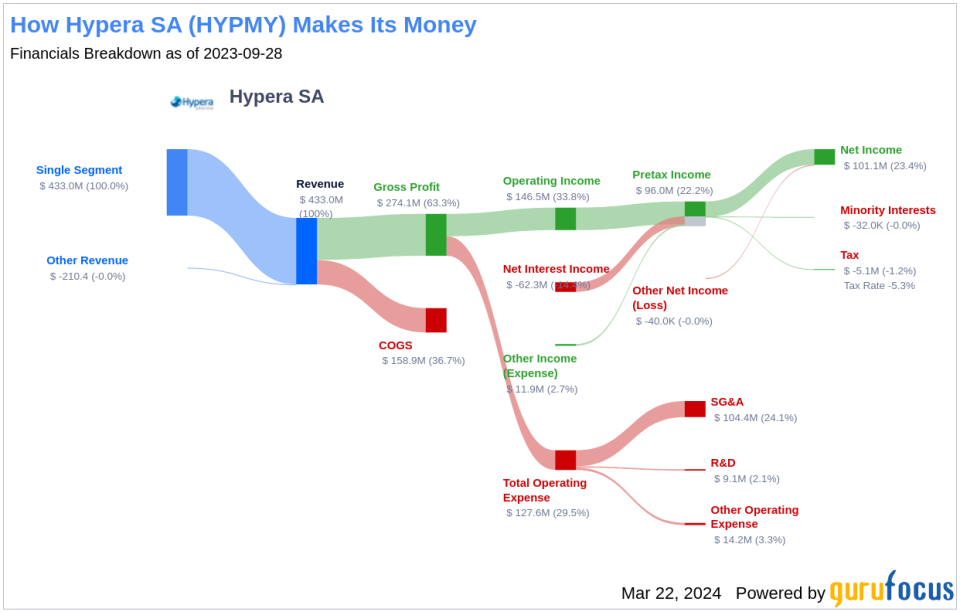
Hypera SA is a specialty and generic drug manufacturing company. The company has a focus on the pharmaceutical segments of the Brazilian market, along with a presence in nonprescription drugs and branded generics. Hypermarcas also possesses a share of generic medicines and prescription products. The company also has a wide sales and distribution structure. The Company's operating segments are Consumer Health, Branded Prescription, Similars e Generics, Skincare and Non-Retail Market.
A Glimpse at Hypera SA's Dividend History
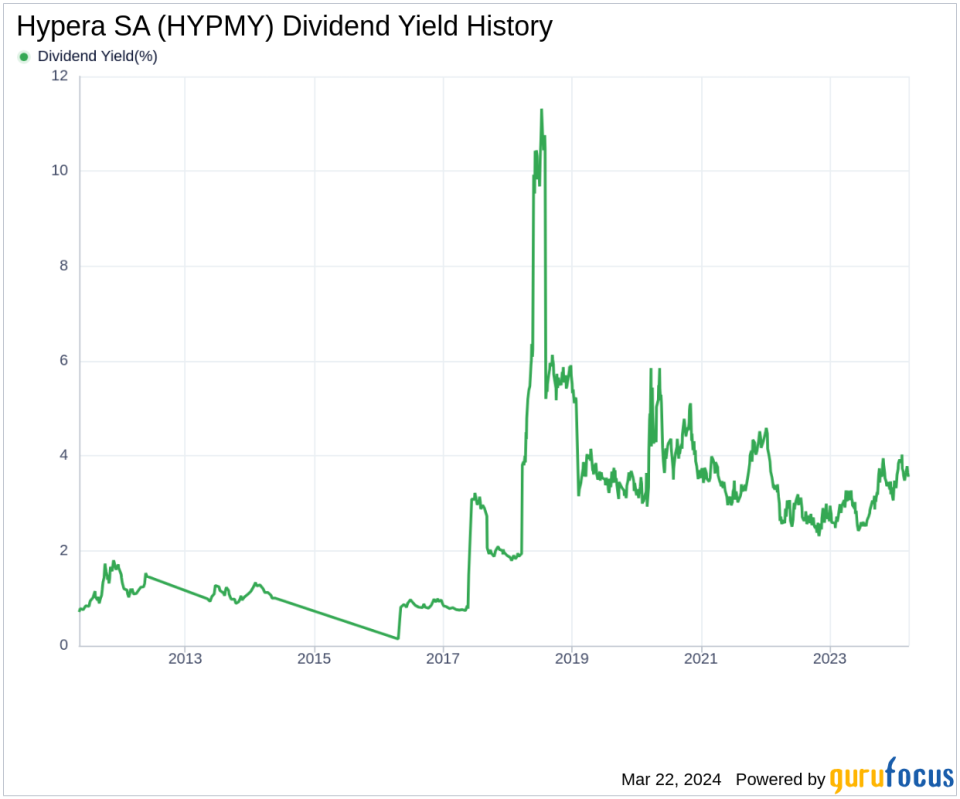
Hypera SA has maintained a consistent dividend payment record since 2016. Dividends are currently distributed on a quarterly basis. Below is a chart showing annual Dividends Per Share for tracking historical trends.
Breaking Down Hypera SA's Dividend Yield and Growth
As of today, Hypera SA currently has a 12-month trailing dividend yield of 2.35% and a 12-month forward dividend yield of 1.74%. This suggests an expectation of decreased dividend payments over the next 12 months.
Over the past three years, Hypera SA's annual dividend growth rate was 1.60%. Extended to a five-year horizon, this rate increased to 4.90% per year. Based on Hypera SA's dividend yield and five-year growth rate, the 5-year yield on cost of Hypera SA stock as of today is approximately 2.99%.
The Sustainability Question: Payout Ratio and Profitability
To assess the sustainability of the dividend, one needs to evaluate the company's payout ratio. The dividend payout ratio provides insights into the portion of earnings the company distributes as dividends. A lower ratio suggests that the company retains a significant part of its earnings, thereby ensuring the availability of funds for future growth and unexpected downturns. As of 2023-12-31, Hypera SA's dividend payout ratio is 0.47.
Hypera SA's profitability rank, offers an understanding of the company's earnings prowess relative to its peers. GuruFocus ranks Hypera SA's profitability 9 out of 10 as of 2023-12-31, suggesting good profitability prospects. The company has reported positive net income for each of year over the past decade, further solidifying its high profitability.
Growth Metrics: The Future Outlook
To ensure the sustainability of dividends, a company must have robust growth metrics. Hypera SA's growth rank of 9 out of 10 suggests that the company's growth trajectory is strong relative to its competitors.
Revenue is the lifeblood of any company, and Hypera SA's revenue per share, combined with the 3-year revenue growth rate, indicates a strong revenue model. Hypera SA's revenue has increased by approximately 24.70% per year on average, a rate that outperforms approximately 87.13% of global competitors.
The company's 3-year EPS growth rate showcases its capability to grow its earnings, a critical component for sustaining dividends in the long run. During the past three years, Hypera SA's earnings increased by approximately 8.60% per year on average, a rate that outperforms approximately 47.14% of global competitors.
Lastly, the company's 5-year EBITDA growth rate of 9.90%, which outperforms approximately 50.98% of global competitors, indicates a solid financial performance.
Engaging Conclusion: Hypera SA's Dividend Outlook
In conclusion, Hypera SA's dividend payments, growth rate, payout ratio, profitability, and growth metrics paint a picture of a company with a stable dividend policy and the potential for future growth. The company's strong market position in the pharmaceutical industry and its consistent financial performance provide confidence in the sustainability of its dividends. Investors interested in stable dividend income and growth prospects may find Hypera SA an attractive option. As the company continues to navigate the market, will its strategic initiatives bolster its dividend appeal further? Value investors may want to keep a close eye on Hypera SA's future financial reports and market activities.
GuruFocus Premium users can screen for high-dividend yield stocks using the High Dividend Yield Screener.
This article, generated by GuruFocus, is designed to provide general insights and is not tailored financial advice. Our commentary is rooted in historical data and analyst projections, utilizing an impartial methodology, and is not intended to serve as specific investment guidance. It does not formulate a recommendation to purchase or divest any stock and does not consider individual investment objectives or financial circumstances. Our objective is to deliver long-term, fundamental data-driven analysis. Be aware that our analysis might not incorporate the most recent, price-sensitive company announcements or qualitative information. GuruFocus holds no position in the stocks mentioned herein.
This article first appeared on GuruFocus.