
 Yahoo Finance
 Paos Holdings Berhad (KLSE:PAOS) Could Be At Risk Of Shrinking As A Company
When researching a stock for investment, what can tell us that the company is in decline? Typically, we'll see the trend of both return on capital employed (ROCE) declining and this usually coincides with a decreasing amount of capital employed. This indicates the company is producing less profit from its investments and its total assets are decreasing. So after glancing at the trends within Paos Holdings Berhad (KLSE:PAOS), we weren't too hopeful.
Return On Capital Employed (ROCE): What Is It?
Just to clarify if you're unsure, ROCE is a metric for evaluating how much pre-tax income (in percentage terms) a company earns on the capital invested in its business. The formula for this calculation on Paos Holdings Berhad is:
Return on Capital Employed = Earnings Before Interest and Tax (EBIT) ÷ (Total Assets - Current Liabilities)
0.013 = RM1.1m ÷ (RM169m - RM81m) (Based on the trailing twelve months to November 2023).
Therefore, Paos Holdings Berhad has an ROCE of 1.3%. In absolute terms, that's a low return and it also under-performs the Household Products industry average of 9.0%.
Check out our latest analysis for Paos Holdings Berhad
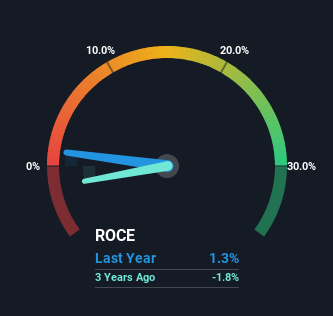
Historical performance is a great place to start when researching a stock so above you can see the gauge for Paos Holdings Berhad's ROCE against it's prior returns. If you want to delve into the historical earnings , check out these free graphs detailing revenue and cash flow performance of Paos Holdings Berhad.
What The Trend Of ROCE Can Tell Us
There is reason to be cautious about Paos Holdings Berhad, given the returns are trending downwards. About five years ago, returns on capital were 1.7%, however they're now substantially lower than that as we saw above. On top of that, it's worth noting that the amount of capital employed within the business has remained relatively steady. Since returns are falling and the business has the same amount of assets employed, this can suggest it's a mature business that hasn't had much growth in the last five years. If these trends continue, we wouldn't expect Paos Holdings Berhad to turn into a multi-bagger.
While on the subject, we noticed that the ratio of current liabilities to total assets has risen to 48%, which has impacted the ROCE. If current liabilities hadn't increased as much as they did, the ROCE could actually be even lower. And with current liabilities at these levels, suppliers or short-term creditors are effectively funding a large part of the business, which can introduce some risks.
The Bottom Line On Paos Holdings Berhad's ROCE
All in all, the lower returns from the same amount of capital employed aren't exactly signs of a compounding machine. And long term shareholders have watched their investments stay flat over the last five years. With underlying trends that aren't great in these areas, we'd consider looking elsewhere.
If you'd like to know more about Paos Holdings Berhad, we've spotted 2 warning signs, and 1 of them is a bit unpleasant.
While Paos Holdings Berhad may not currently earn the highest returns, we've compiled a list of companies that currently earn more than 25% return on equity. Check out this free list here.
Have feedback on this article? Concerned about the content? Get in touch with us directly. Alternatively, email editorial-team (at) simplywallst.com.
This article by Simply Wall St is general in nature. We provide commentary based on historical data and analyst forecasts only using an unbiased methodology and our articles are not intended to be financial advice. It does not constitute a recommendation to buy or sell any stock, and does not take account of your objectives, or your financial situation. We aim to bring you long-term focused analysis driven by fundamental data. Note that our analysis may not factor in the latest price-sensitive company announcements or qualitative material. Simply Wall St has no position in any stocks mentioned.
