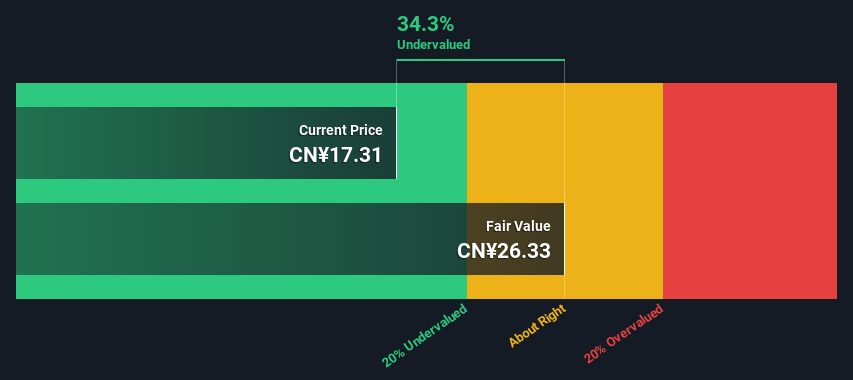
Using the 2 Stage Free Cash Flow to Equity, Guizhou Sanli PharmaceuticalLtd fair value estimate is CN¥26.33
Guizhou Sanli PharmaceuticalLtd's CN¥17.31 share price signals that it might be 34% undervalued
Our fair value estimate is 33% higher than Guizhou Sanli PharmaceuticalLtd's analyst price target of CN¥19.84
In this article we are going to estimate the intrinsic value of Guizhou Sanli Pharmaceutical Co.,Ltd (SHSE:603439) by taking the expected future cash flows and discounting them to today's value. We will take advantage of the Discounted Cash Flow (DCF) model for this purpose. There's really not all that much to it, even though it might appear quite complex.
Companies can be valued in a lot of ways, so we would point out that a DCF is not perfect for every situation. If you still have some burning questions about this type of valuation, take a look at the Simply Wall St analysis model.
Crunching The Numbers
We're using the 2-stage growth model, which simply means we take in account two stages of company's growth. In the initial period the company may have a higher growth rate and the second stage is usually assumed to have a stable growth rate. To begin with, we have to get estimates of the next ten years of cash flows. Seeing as no analyst estimates of free cash flow are available to us, we have extrapolate the previous free cash flow (FCF) from the company's last reported value. We assume companies with shrinking free cash flow will slow their rate of shrinkage, and that companies with growing free cash flow will see their growth rate slow, over this period. We do this to reflect that growth tends to slow more in the early years than it does in later years.
Generally we assume that a dollar today is more valuable than a dollar in the future, so we need to discount the sum of these future cash flows to arrive at a present value estimate:
10-year free cash flow (FCF) estimate
2024
2025
2026
2027
2028
2029
2030
2031
2032
2033
Levered FCF (CN¥, Millions)
CN¥284.4m
CN¥350.5m
CN¥410.6m
CN¥463.5m
CN¥509.4m
CN¥549.2m
CN¥584.1m
CN¥615.2m
CN¥643.6m
CN¥670.0m
Growth Rate Estimate Source
Est @ 31.93%
Est @ 23.23%
Est @ 17.14%
Est @ 12.88%
Est @ 9.90%
Est @ 7.81%
Est @ 6.35%
Est @ 5.33%
Est @ 4.61%
Est @ 4.11%
Present Value (CN¥, Millions) Discounted @ 7.4%
CN¥265
CN¥304
CN¥331
CN¥348
CN¥356
CN¥357
CN¥353
CN¥346
CN¥337
CN¥327
("Est" = FCF growth rate estimated by Simply Wall St) Present Value of 10-year Cash Flow (PVCF) = CN¥3.3b
After calculating the present value of future cash flows in the initial 10-year period, we need to calculate the Terminal Value, which accounts for all future cash flows beyond the first stage. For a number of reasons a very conservative growth rate is used that cannot exceed that of a country's GDP growth. In this case we have used the 5-year average of the 10-year government bond yield (2.9%) to estimate future growth. In the same way as with the 10-year 'growth' period, we discount future cash flows to today's value, using a cost of equity of 7.4%.
Present Value of Terminal Value (PVTV)= TV / (1 + r)10= CN¥15b÷ ( 1 + 7.4%)10= CN¥7.5b
The total value is the sum of cash flows for the next ten years plus the discounted terminal value, which results in the Total Equity Value, which in this case is CN¥11b. To get the intrinsic value per share, we divide this by the total number of shares outstanding. Compared to the current share price of CN¥17.3, the company appears quite good value at a 34% discount to where the stock price trades currently. Remember though, that this is just an approximate valuation, and like any complex formula - garbage in, garbage out.
SHSE:603439 Discounted Cash Flow March 15th 2024
Important Assumptions
The calculation above is very dependent on two assumptions. The first is the discount rate and the other is the cash flows. If you don't agree with these result, have a go at the calculation yourself and play with the assumptions. The DCF also does not consider the possible cyclicality of an industry, or a company's future capital requirements, so it does not give a full picture of a company's potential performance. Given that we are looking at Guizhou Sanli PharmaceuticalLtd as potential shareholders, the cost of equity is used as the discount rate, rather than the cost of capital (or weighted average cost of capital, WACC) which accounts for debt. In this calculation we've used 7.4%, which is based on a levered beta of 0.800. Beta is a measure of a stock's volatility, compared to the market as a whole. We get our beta from the industry average beta of globally comparable companies, with an imposed limit between 0.8 and 2.0, which is a reasonable range for a stable business.
SWOT Analysis for Guizhou Sanli PharmaceuticalLtd
Strength
Earnings growth over the past year exceeded the industry.
Debt is not viewed as a risk.
Dividends are covered by earnings and cash flows.
Dividend information for 603439.
Weakness
Dividend is low compared to the top 25% of dividend payers in the Pharmaceuticals market.
Opportunity
Annual revenue is forecast to grow faster than the Chinese market.
Trading below our estimate of fair value by more than 20%.
Threat
Annual earnings are forecast to grow slower than the Chinese market.
What else are analysts forecasting for 603439?
Moving On:
Valuation is only one side of the coin in terms of building your investment thesis, and it is only one of many factors that you need to assess for a company. DCF models are not the be-all and end-all of investment valuation. Preferably you'd apply different cases and assumptions and see how they would impact the company's valuation. If a company grows at a different rate, or if its cost of equity or risk free rate changes sharply, the output can look very different. What is the reason for the share price sitting below the intrinsic value? For Guizhou Sanli PharmaceuticalLtd, we've put together three relevant elements you should consider:
Financial Health: Does 603439 have a healthy balance sheet? Take a look at our free balance sheet analysis with six simple checks on key factors like leverage and risk.
Future Earnings: How does 603439's growth rate compare to its peers and the wider market? Dig deeper into the analyst consensus number for the upcoming years by interacting with our free analyst growth expectation chart.
Other High Quality Alternatives: Do you like a good all-rounder? Explore our interactive list of high quality stocks to get an idea of what else is out there you may be missing!
PS. The Simply Wall St app conducts a discounted cash flow valuation for every stock on the SHSE every day. If you want to find the calculation for other stocks just search here.
Have feedback on this article? Concerned about the content?Get in touch with us directly. Alternatively, email editorial-team (at) simplywallst.com. This article by Simply Wall St is general in nature. We provide commentary based on historical data and analyst forecasts only using an unbiased methodology and our articles are not intended to be financial advice. It does not constitute a recommendation to buy or sell any stock, and does not take account of your objectives, or your financial situation. We aim to bring you long-term focused analysis driven by fundamental data. Note that our analysis may not factor in the latest price-sensitive company announcements or qualitative material. Simply Wall St has no position in any stocks mentioned.

 Generally we assume that a dollar today is more valuable than a dollar in the future, so we need to discount the sum of these future cash flows to arrive at a present value estimate:
  通常,我們假設今天的一美元比未來一美元更有價值,因此我們需要對這些未來現金流的總和進行折價才能得出現值估計: