
Calculating The Fair Value Of Penumbra, Inc. (NYSE:PEN)
Calculating The Fair Value Of Penumbra, Inc. (NYSE:PEN)
Key Insights
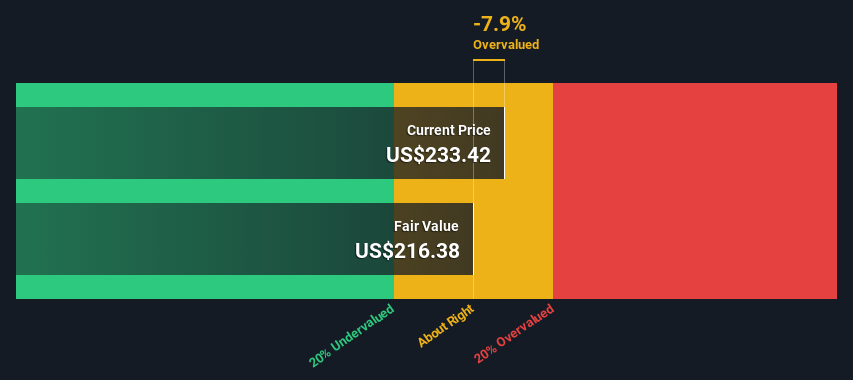
- Using the 2 Stage Free Cash Flow to Equity, Penumbra fair value estimate is US$216
- With US$233 share price, Penumbra appears to be trading close to its estimated fair value
- Our fair value estimate is 23% lower than Penumbra's analyst price target of US$281
Does the March share price for Penumbra, Inc. (NYSE:PEN) reflect what it's really worth? Today, we will estimate the stock's intrinsic value by estimating the company's future cash flows and discounting them to their present value. We will take advantage of the Discounted Cash Flow (DCF) model for this purpose. Don't get put off by the jargon, the math behind it is actually quite straightforward.
Remember though, that there are many ways to estimate a company's value, and a DCF is just one method. If you still have some burning questions about this type of valuation, take a look at the Simply Wall St analysis model.
Step By Step Through The Calculation
We use what is known as a 2-stage model, which simply means we have two different periods of growth rates for the company's cash flows. Generally the first stage is higher growth, and the second stage is a lower growth phase. In the first stage we need to estimate the cash flows to the business over the next ten years. Where possible we use analyst estimates, but when these aren't available we extrapolate the previous free cash flow (FCF) from the last estimate or reported value. We assume companies with shrinking free cash flow will slow their rate of shrinkage, and that companies with growing free cash flow will see their growth rate slow, over this period. We do this to reflect that growth tends to slow more in the early years than it does in later years.
Generally we assume that a dollar today is more valuable than a dollar in the future, so we discount the value of these future cash flows to their estimated value in today's dollars:
10-year free cash flow (FCF) estimate
| 2024 | 2025 | 2026 | 2027 | 2028 | 2029 | 2030 | 2031 | 2032 | 2033 | |
| Levered FCF ($, Millions) | US$105.3m | US$127.3m | US$160.3m | US$243.0m | US$309.0m | US$358.6m | US$401.4m | US$437.6m | US$468.3m | US$494.5m |
| Growth Rate Estimate Source | Analyst x5 | Analyst x4 | Analyst x3 | Analyst x1 | Analyst x1 | Est @ 16.06% | Est @ 11.93% | Est @ 9.03% | Est @ 7.01% | Est @ 5.59% |
| Present Value ($, Millions) Discounted @ 6.5% | US$98.8 | US$112 | US$133 | US$189 | US$225 | US$245 | US$258 | US$264 | US$265 | US$263 |
("Est" = FCF growth rate estimated by Simply Wall St)
Present Value of 10-year Cash Flow (PVCF) = US$2.1b
The second stage is also known as Terminal Value, this is the business's cash flow after the first stage. The Gordon Growth formula is used to calculate Terminal Value at a future annual growth rate equal to the 5-year average of the 10-year government bond yield of 2.3%. We discount the terminal cash flows to today's value at a cost of equity of 6.5%.
Terminal Value (TV)= FCF2033 × (1 + g) ÷ (r – g) = US$495m× (1 + 2.3%) ÷ (6.5%– 2.3%) = US$12b
Present Value of Terminal Value (PVTV)= TV / (1 + r)10= US$12b÷ ( 1 + 6.5%)10= US$6.3b
The total value is the sum of cash flows for the next ten years plus the discounted terminal value, which results in the Total Equity Value, which in this case is US$8.4b. The last step is to then divide the equity value by the number of shares outstanding. Relative to the current share price of US$233, the company appears around fair value at the time of writing. The assumptions in any calculation have a big impact on the valuation, so it is better to view this as a rough estimate, not precise down to the last cent.
Important Assumptions
The calculation above is very dependent on two assumptions. The first is the discount rate and the other is the cash flows. Part of investing is coming up with your own evaluation of a company's future performance, so try the calculation yourself and check your own assumptions. The DCF also does not consider the possible cyclicality of an industry, or a company's future capital requirements, so it does not give a full picture of a company's potential performance. Given that we are looking at Penumbra as potential shareholders, the cost of equity is used as the discount rate, rather than the cost of capital (or weighted average cost of capital, WACC) which accounts for debt. In this calculation we've used 6.5%, which is based on a levered beta of 0.923. Beta is a measure of a stock's volatility, compared to the market as a whole. We get our beta from the industry average beta of globally comparable companies, with an imposed limit between 0.8 and 2.0, which is a reasonable range for a stable business.
SWOT Analysis for Penumbra
- Currently debt free.
- Balance sheet summary for PEN.
- Expensive based on P/E ratio and estimated fair value.
- Annual earnings are forecast to grow faster than the American market.
- Revenue is forecast to grow slower than 20% per year.
- What else are analysts forecasting for PEN?
Moving On:
Although the valuation of a company is important, it is only one of many factors that you need to assess for a company. DCF models are not the be-all and end-all of investment valuation. Instead the best use for a DCF model is to test certain assumptions and theories to see if they would lead to the company being undervalued or overvalued. For instance, if the terminal value growth rate is adjusted slightly, it can dramatically alter the overall result. For Penumbra, we've put together three further elements you should consider:
- Financial Health: Does PEN have a healthy balance sheet? Take a look at our free balance sheet analysis with six simple checks on key factors like leverage and risk.
- Future Earnings: How does PEN's growth rate compare to its peers and the wider market? Dig deeper into the analyst consensus number for the upcoming years by interacting with our free analyst growth expectation chart.
- Other Solid Businesses: Low debt, high returns on equity and good past performance are fundamental to a strong business. Why not explore our interactive list of stocks with solid business fundamentals to see if there are other companies you may not have considered!
PS. The Simply Wall St app conducts a discounted cash flow valuation for every stock on the NYSE every day. If you want to find the calculation for other stocks just search here.
Have feedback on this article? Concerned about the content? Get in touch with us directly. Alternatively, email editorial-team (at) simplywallst.com.
This article by Simply Wall St is general in nature. We provide commentary based on historical data and analyst forecasts only using an unbiased methodology and our articles are not intended to be financial advice. It does not constitute a recommendation to buy or sell any stock, and does not take account of your objectives, or your financial situation. We aim to bring you long-term focused analysis driven by fundamental data. Note that our analysis may not factor in the latest price-sensitive company announcements or qualitative material. Simply Wall St has no position in any stocks mentioned.
關鍵見解
- 使用兩階段的股本自由現金流,Penumbra的公允價值估計爲216美元
- Penumbra的股價爲233美元,其交易價格似乎接近其估計的公允價值
- 我們的公允價值估計比Penumbra的分析師目標股價281美元低23%
Penumbra, Inc.(紐約證券交易所代碼:PEN)3月份的股價是否反映了其真正價值?今天,我們將通過估算公司未來的現金流並將其折現爲現值來估算股票的內在價值。爲此,我們將利用折扣現金流 (DCF) 模型。不要被行話嚇跑,它背後的數學其實很簡單。
但請記住,估算公司價值的方法有很多,而差價合約只是一種方法。如果你對這種估值還有一些迫切的問題,可以看看 Simply Wall St 分析模型。
逐步進行計算
我們使用所謂的兩階段模型,這僅意味着公司的現金流有兩個不同的增長期。通常,第一階段是較高的增長階段,第二階段是較低的增長階段。在第一階段,我們需要估算未來十年的業務現金流。在可能的情況下,我們會使用分析師的估計值,但是當這些估計值不可用時,我們會從最新的估計值或報告的價值中推斷出之前的自由現金流(FCF)。我們假設自由現金流萎縮的公司將減緩其萎縮速度,而自由現金流不斷增長的公司在此期間的增長率將放緩。我們這樣做是爲了反映早期增長的放緩幅度往往比後來的幾年更大。
通常,我們假設今天的一美元比未來一美元更有價值,因此我們將這些未來現金流的價值折現爲以今天的美元計算的估計價值:
10 年自由現金流 (FCF) 估計
| 2024 | 2025 | 2026 | 2027 | 2028 | 2029 | 2030 | 2031 | 2032 | 2033 | |
| Levered FCF(美元,百萬) | 1.053 億美元 | 1.273 億美元 | 1.603 億美元 | 2.430 億美元 | 309.0 億美元 | 3.586 億美元 | 401.4 億美元 | 437.6 億美元 | 4.683 億美元 | 494.5 億美元 |
| 增長率估算來源 | 分析師 x5 | 分析師 x4 | 分析師 x3 | 分析師 x1 | 分析師 x1 | 美國東部標準時間 @ 16.06% | 美國東部標準時間 @ 11.93% | 美國東部標準時間 @ 9.03% | Est @ 7.01% | Est @ 5.59% |
| 現值 (美元, 百萬美元) 折扣 @ 6.5% | 98.8 美元 | 112 美元 | 133 美元 | 189 美元 | 225 美元 | 245 美元 | 258 美元 | 264 美元 | 265 美元 | 263 美元 |
(“Est” = Simply Wall St估計的FCF增長率)
10年期現金流(PVCF)的現值 = 21億美元
第二階段也稱爲終值,這是第一階段之後的企業現金流。戈登增長公式用於計算終值,其未來年增長率等於10年期國債收益率2.3%的5年平均水平。我們將終端現金流折現爲今天的價值,權益成本爲6.5%。
終端價值 (TV) = FCF2033 × (1 + g) ÷ (r — g) = 4.95億美元× (1 + 2.3%) ÷ (6.5% — 2.3%) = 120億美元
終端價值的現值 (PVTV) = 電視/ (1 + r)10= 120億美元÷ (1 + 6.5%)10= 63 億美元
總價值是未來十年的現金流總額加上貼現的終端價值,由此得出總權益價值,在本例中爲84億美元。最後一步是將股票價值除以已發行股票的數量。相對於目前的233美元股價,該公司在撰寫本文時看似公允價值。任何計算中的假設都會對估值產生重大影響,因此最好將其視爲粗略的估計,而不是精確到最後一美分。
重要假設
上面的計算在很大程度上取決於兩個假設。第一個是貼現率,另一個是現金流。投資的一部分是自己對公司未來業績的評估,因此請自己嘗試計算並檢查自己的假設。DCF也沒有考慮一個行業可能的週期性,也沒有考慮公司未來的資本需求,因此它沒有全面反映公司的潛在表現。鑑於我們將Penumbra視爲潛在股東,因此使用權益成本作爲貼現率,而不是構成債務的資本成本(或加權平均資本成本,WACC)。在此計算中,我們使用了6.5%,這是基於0.923的槓桿測試版。Beta是衡量股票與整個市場相比波動性的指標。我們的測試版來自全球可比公司的行業平均貝塔值,設定在0.8到2.0之間,這是一個穩定的業務的合理範圍。
Penumbra 的 SWOT 分析
- 目前無債務。
- PEN 的資產負債表摘要。
- 根據市盈率和估計的公允價值,價格昂貴。
- 預計年收入的增長速度將快於美國市場。
- 預計收入每年增長將低於20%。
- 分析師對PEN還有什麼預測?
繼續前進:
儘管公司的估值很重要,但它只是公司需要評估的衆多因素之一。DCF模型並不是投資估值的萬能藥。取而代之的是,DCF模型的最佳用途是測試某些假設和理論,看看它們是否會導致公司被低估或高估。例如,如果稍微調整終值增長率,則可能會極大地改變整體結果。對於 Penumbra,我們彙總了另外三個你應該考慮的元素:
- 財務狀況:PEN的資產負債表是否良好?看看我們的免費資產負債表分析,其中包含對槓桿和風險等關鍵因素的六項簡單檢查。
- 未來收益:與同行和整個市場相比,PEN的增長率如何?通過與我們的免費分析師增長預期圖表互動,深入了解未來幾年的分析師共識數字。
- 其他穩健的業務:低債務、高股本回報率和良好的過去表現是強大業務的基礎。爲什麼不瀏覽我們具有堅實業務基礎的股票互動清單,看看是否還有其他你可能沒有考慮過的公司!
PS。Simply Wall St應用程序每天對紐約證券交易所的每隻股票進行折扣現金流估值。如果您想找到其他股票的計算方法,請在此處搜索。
對這篇文章有反饋嗎?對內容感到擔憂?直接聯繫我們。 或者,給編輯團隊 (at) simplywallst.com 發送電子郵件。
Simply Wall St的這篇文章本質上是籠統的。我們僅使用公正的方法根據歷史數據和分析師的預測提供評論,我們的文章無意作爲財務建議。它不構成買入或賣出任何股票的建議,也沒有考慮到您的目標或財務狀況。我們的目標是爲您提供由基本數據驅動的長期重點分析。請注意,我們的分析可能不考慮最新的價格敏感型公司公告或定性材料。簡而言之,華爾街沒有持有任何上述股票的頭寸。
譯文內容由第三人軟體翻譯。
風險及免責聲明
- 分享到weixin
- 分享到qq
- 分享到facebook
- 分享到twitter
- 分享到微博
- 粘贴板
使用瀏覽器的分享功能,分享給你的好友吧