
Why We Like The Returns At Genie Energy (NYSE:GNE)
Why We Like The Returns At Genie Energy (NYSE:GNE)
If you're looking for a multi-bagger, there's a few things to keep an eye out for. Firstly, we'll want to see a proven return on capital employed (ROCE) that is increasing, and secondly, an expanding base of capital employed. This shows us that it's a compounding machine, able to continually reinvest its earnings back into the business and generate higher returns. Speaking of which, we noticed some great changes in Genie Energy's (NYSE:GNE) returns on capital, so let's have a look.
如果你正在尋找一款多功能裝袋機,有幾件事需要注意。首先,我們希望看到經過驗證的 返回 關於正在增加的資本使用率(ROCE),其次是擴大 基礎 所用資本的比例。這向我們表明,它是一臺複合機器,能夠持續將其收益再投資到業務中併產生更高的回報。說到這裏,我們注意到精靈能源(紐約證券交易所代碼:GNE)的資本回報率發生了一些重大變化,所以讓我們來看看吧。
What Is Return On Capital Employed (ROCE)?
什麼是資本使用回報率(ROCE)?
For those who don't know, ROCE is a measure of a company's yearly pre-tax profit (its return), relative to the capital employed in the business. To calculate this metric for Genie Energy, this is the formula:
對於那些不知道的人來說,ROCE是衡量公司年度稅前利潤(其回報率)的指標,相對於該業務使用的資本。要計算 Genie Energy 的這個指標,公式如下:
Return on Capital Employed = Earnings Before Interest and Tax (EBIT) ÷ (Total Assets - Current Liabilities)
已動用資本回報率 = 息稅前收益 (EBIT) ¥(總資產-流動負債)
0.24 = US$55m ÷ (US$331m - US$98m) (Based on the trailing twelve months to December 2023).
0.24 = 5500萬美元 ÷(3.31億美元-9800萬美元) (基於截至2023年12月的過去十二個月)。
Therefore, Genie Energy has an ROCE of 24%. In absolute terms that's a great return and it's even better than the Electric Utilities industry average of 4.6%.
因此,精靈能源的投資回報率爲24%。從絕對值來看,這是一個不錯的回報,甚至比電力公用事業行業平均水平的4.6%還要好。
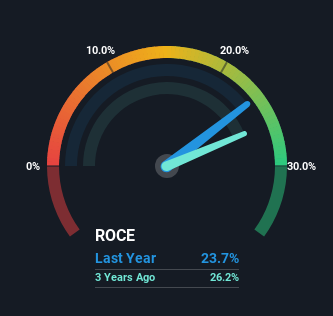
While the past is not representative of the future, it can be helpful to know how a company has performed historically, which is why we have this chart above. If you'd like to look at how Genie Energy has performed in the past in other metrics, you can view this free graph of Genie Energy's past earnings, revenue and cash flow.
雖然過去並不能代表未來,但了解一家公司的歷史表現可能會有所幫助,這就是我們上面有這張圖表的原因。如果你想在其他指標中查看Genie Energy過去的表現,你可以查看這張免費的Genie Energy過去收益、收入和現金流圖表。
What Does the ROCE Trend For Genie Energy Tell Us?
精靈能源的投資回報率趨勢告訴我們什麼?
We like the trends that we're seeing from Genie Energy. The numbers show that in the last five years, the returns generated on capital employed have grown considerably to 24%. The amount of capital employed has increased too, by 142%. The increasing returns on a growing amount of capital is common amongst multi-baggers and that's why we're impressed.
我們喜歡從精靈能源看到的趨勢。數字顯示,在過去五年中,所用資本的回報率已大幅增長至24%。使用的資本金額也增加了142%。越來越多的資本所帶來的回報率不斷增加在多袋公司中很常見,這就是爲什麼我們印象深刻的原因。
The Bottom Line
底線
A company that is growing its returns on capital and can consistently reinvest in itself is a highly sought after trait, and that's what Genie Energy has. Since the stock has returned a staggering 116% to shareholders over the last five years, it looks like investors are recognizing these changes. With that being said, we still think the promising fundamentals mean the company deserves some further due diligence.
一家資本回報率不斷提高且能夠持續進行自我再投資的公司是一個備受追捧的特徵,而這正是Genie Energy所擁有的。由於該股在過去五年中向股東回報了驚人的116%,因此投資者似乎已經意識到了這些變化。話雖如此,我們仍然認爲前景良好的基本面意味着公司值得進一步的盡職調查。
Genie Energy does have some risks though, and we've spotted 4 warning signs for Genie Energy that you might be interested in.
但是,Genie Energy確實存在一些風險,我們已經發現了4個你可能會感興趣的精靈能量警告信號。
If you'd like to see other companies earning high returns, check out our free list of companies earning high returns with solid balance sheets here.
如果您想看到其他公司獲得高回報,請在此處查看我們的免費高回報且資產負債表穩健的公司名單。
Have feedback on this article? Concerned about the content? Get in touch with us directly. Alternatively, email editorial-team (at) simplywallst.com.
This article by Simply Wall St is general in nature. We provide commentary based on historical data and analyst forecasts only using an unbiased methodology and our articles are not intended to be financial advice. It does not constitute a recommendation to buy or sell any stock, and does not take account of your objectives, or your financial situation. We aim to bring you long-term focused analysis driven by fundamental data. Note that our analysis may not factor in the latest price-sensitive company announcements or qualitative material. Simply Wall St has no position in any stocks mentioned.
對這篇文章有反饋嗎?對內容感到擔憂?直接聯繫我們。 或者,給編輯團隊 (at) simplywallst.com 發送電子郵件。
Simply Wall St的這篇文章本質上是籠統的。我們僅使用公正的方法根據歷史數據和分析師的預測提供評論,我們的文章無意作爲財務建議。它不構成買入或賣出任何股票的建議,也沒有考慮到您的目標或財務狀況。我們的目標是爲您提供由基本數據驅動的長期重點分析。請注意,我們的分析可能不考慮最新的價格敏感型公司公告或定性材料。簡而言之,華爾街沒有持有任何上述股票的頭寸。
譯文內容由第三人軟體翻譯。