
 Yahoo Finance
 Even though Sensirion Holding (VTX:SENS) has lost CHF67m market cap in last 7 days, shareholders are still up 48% over 5 years
While Sensirion Holding AG (VTX:SENS) shareholders are probably generally happy, the stock hasn't had particularly good run recently, with the share price falling 23% in the last quarter. On the bright side the returns have been quite good over the last half decade. After all, the share price is up a market-beating 48% in that time. While the long term returns are impressive, we do have some sympathy for those who bought more recently, given the 42% drop, in the last year.
Since the long term performance has been good but there's been a recent pullback of 6.3%, let's check if the fundamentals match the share price.
See our latest analysis for Sensirion Holding
In his essay The Superinvestors of Graham-and-Doddsville Warren Buffett described how share prices do not always rationally reflect the value of a business. One imperfect but simple way to consider how the market perception of a company has shifted is to compare the change in the earnings per share (EPS) with the share price movement.
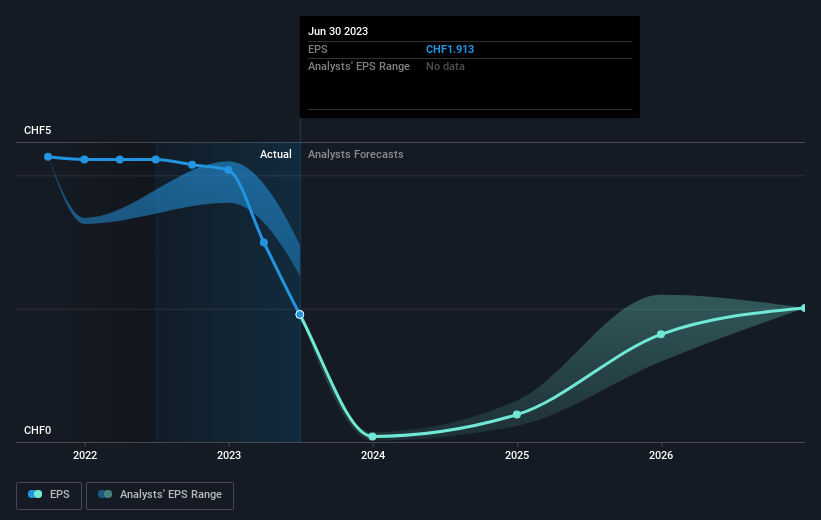
During the last half decade, Sensirion Holding became profitable. That would generally be considered a positive, so we'd expect the share price to be up. Since the company was unprofitable five years ago, but not three years ago, it's worth taking a look at the returns in the last three years, too. We can see that the Sensirion Holding share price is up 5.4% in the last three years. In the same period, EPS is up 40% per year. This EPS growth is higher than the 1.8% average annual increase in the share price over the same three years. So you might conclude the market is a little more cautious about the stock, these days.
The image below shows how EPS has tracked over time (if you click on the image you can see greater detail).
We're pleased to report that the CEO is remunerated more modestly than most CEOs at similarly capitalized companies. But while CEO remuneration is always worth checking, the really important question is whether the company can grow earnings going forward. Dive deeper into the earnings by checking this interactive graph of Sensirion Holding's earnings, revenue and cash flow.
A Different Perspective
Sensirion Holding shareholders are down 42% for the year, but the market itself is up 9.7%. However, keep in mind that even the best stocks will sometimes underperform the market over a twelve month period. Longer term investors wouldn't be so upset, since they would have made 8%, each year, over five years. If the fundamental data continues to indicate long term sustainable growth, the current sell-off could be an opportunity worth considering. I find it very interesting to look at share price over the long term as a proxy for business performance. But to truly gain insight, we need to consider other information, too. Even so, be aware that Sensirion Holding is showing 3 warning signs in our investment analysis , and 1 of those makes us a bit uncomfortable...
If you would prefer to check out another company -- one with potentially superior financials -- then do not miss this free list of companies that have proven they can grow earnings.
Please note, the market returns quoted in this article reflect the market weighted average returns of stocks that currently trade on Swiss exchanges.
Have feedback on this article? Concerned about the content? Get in touch with us directly. Alternatively, email editorial-team (at) simplywallst.com.
This article by Simply Wall St is general in nature. We provide commentary based on historical data and analyst forecasts only using an unbiased methodology and our articles are not intended to be financial advice. It does not constitute a recommendation to buy or sell any stock, and does not take account of your objectives, or your financial situation. We aim to bring you long-term focused analysis driven by fundamental data. Note that our analysis may not factor in the latest price-sensitive company announcements or qualitative material. Simply Wall St has no position in any stocks mentioned.
