
This month, we saw the Shang Gong Group Co., Ltd. (SHSE:600843) up an impressive 38%. But if you look at the last five years the returns have not been good. After all, the share price is down 40% in that time, significantly under-performing the market.
While the last five years has been tough for Shang Gong Group shareholders, this past week has shown signs of promise. So let's look at the longer term fundamentals and see if they've been the driver of the negative returns.
While the efficient markets hypothesis continues to be taught by some, it has been proven that markets are over-reactive dynamic systems, and investors are not always rational. By comparing earnings per share (EPS) and share price changes over time, we can get a feel for how investor attitudes to a company have morphed over time.
 Looking back five years, both Shang Gong Group's share price and EPS declined; the latter at a rate of 16% per year. This fall in the EPS is worse than the 10% compound annual share price fall. The relatively muted share price reaction might be because the market expects the business to turn around. The high P/E ratio of 50.29 suggests that shareholders believe earnings will grow in the years ahead.
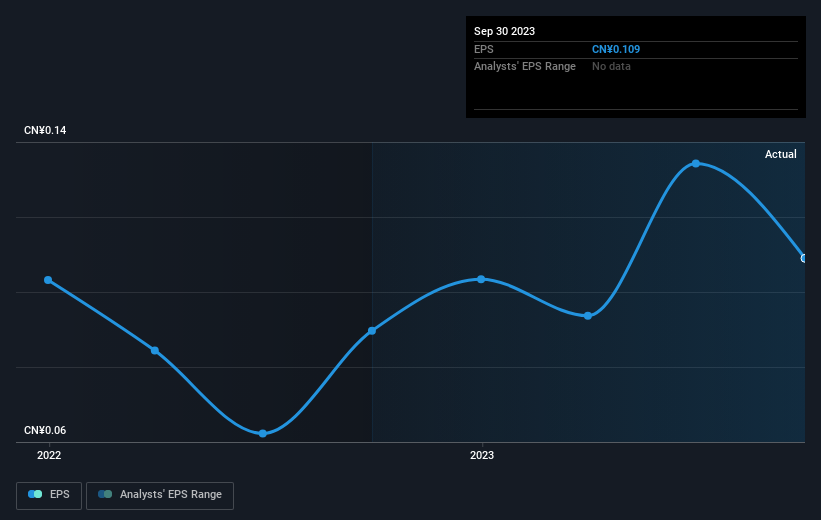
You can see below how EPS has changed over time (discover the exact values by clicking on the image).
It might be well worthwhile taking a look at our free report on Shang Gong Group's earnings, revenue and cash flow.
A Different Perspective
We're pleased to report that Shang Gong Group shareholders have received a total shareholder return of 4.5% over one year. Of course, that includes the dividend. That certainly beats the loss of about 7% per year over the last half decade. This makes us a little wary, but the business might have turned around its fortunes. I find it very interesting to look at share price over the long term as a proxy for business performance. But to truly gain insight, we need to consider other information, too. Even so, be aware that Shang Gong Group is showing 3 warning signs in our investment analysis , and 1 of those makes us a bit uncomfortable...
For those who like to find winning investments this free list of growing companies with recent insider purchasing, could be just the ticket.
Please note, the market returns quoted in this article reflect the market weighted average returns of stocks that currently trade on Chinese exchanges.
Have feedback on this article? Concerned about the content? Get in touch with us directly. Alternatively, email editorial-team (at) simplywallst.com.
This article by Simply Wall St is general in nature. We provide commentary based on historical data and analyst forecasts only using an unbiased methodology and our articles are not intended to be financial advice. It does not constitute a recommendation to buy or sell any stock, and does not take account of your objectives, or your financial situation. We aim to bring you long-term focused analysis driven by fundamental data. Note that our analysis may not factor in the latest price-sensitive company announcements or qualitative material. Simply Wall St has no position in any stocks mentioned.