
 Yahoo Finance
 Investors Will Want ActivePort Group's (ASX:ATV) Growth In ROCE To Persist
If you're looking for a multi-bagger, there's a few things to keep an eye out for. Firstly, we'd want to identify a growing return on capital employed (ROCE) and then alongside that, an ever-increasing base of capital employed. Ultimately, this demonstrates that it's a business that is reinvesting profits at increasing rates of return. So on that note, ActivePort Group (ASX:ATV) looks quite promising in regards to its trends of return on capital.
What Is Return On Capital Employed (ROCE)?
For those who don't know, ROCE is a measure of a company's yearly pre-tax profit (its return), relative to the capital employed in the business. To calculate this metric for ActivePort Group, this is the formula:
Return on Capital Employed = Earnings Before Interest and Tax (EBIT) ÷ (Total Assets - Current Liabilities)
0.063 = AU$1.9m ÷ (AU$40m - AU$9.1m) (Based on the trailing twelve months to December 2023).
Therefore, ActivePort Group has an ROCE of 6.3%. In absolute terms, that's a low return and it also under-performs the Software industry average of 13%.
See our latest analysis for ActivePort Group
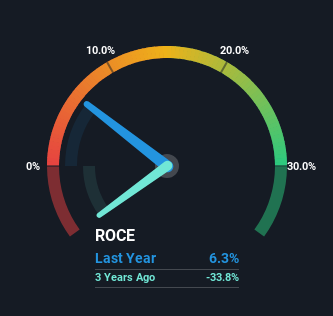
Historical performance is a great place to start when researching a stock so above you can see the gauge for ActivePort Group's ROCE against it's prior returns. If you want to delve into the historical earnings , check out these free graphs detailing revenue and cash flow performance of ActivePort Group.
So How Is ActivePort Group's ROCE Trending?
We're delighted to see that ActivePort Group is reaping rewards from its investments and is now generating some pre-tax profits. Shareholders would no doubt be pleased with this because the business was loss-making three years ago but is is now generating 6.3% on its capital. And unsurprisingly, like most companies trying to break into the black, ActivePort Group is utilizing 553% more capital than it was three years ago. This can indicate that there's plenty of opportunities to invest capital internally and at ever higher rates, both common traits of a multi-bagger.
In Conclusion...
In summary, it's great to see that ActivePort Group has managed to break into profitability and is continuing to reinvest in its business. And since the stock has fallen 46% over the last year, there might be an opportunity here. So researching this company further and determining whether or not these trends will continue seems justified.
On a final note, we found 4 warning signs for ActivePort Group (1 is significant) you should be aware of.
While ActivePort Group may not currently earn the highest returns, we've compiled a list of companies that currently earn more than 25% return on equity. Check out this free list here.
Have feedback on this article? Concerned about the content? Get in touch with us directly. Alternatively, email editorial-team (at) simplywallst.com.
This article by Simply Wall St is general in nature. We provide commentary based on historical data and analyst forecasts only using an unbiased methodology and our articles are not intended to be financial advice. It does not constitute a recommendation to buy or sell any stock, and does not take account of your objectives, or your financial situation. We aim to bring you long-term focused analysis driven by fundamental data. Note that our analysis may not factor in the latest price-sensitive company announcements or qualitative material. Simply Wall St has no position in any stocks mentioned.
