
 Yahoo Finance
 Here's What's Concerning About Eonmetall Group Berhad's (KLSE:EMETALL) Returns On Capital
Did you know there are some financial metrics that can provide clues of a potential multi-bagger? Typically, we'll want to notice a trend of growing return on capital employed (ROCE) and alongside that, an expanding base of capital employed. If you see this, it typically means it's a company with a great business model and plenty of profitable reinvestment opportunities. In light of that, when we looked at Eonmetall Group Berhad (KLSE:EMETALL) and its ROCE trend, we weren't exactly thrilled.
Return On Capital Employed (ROCE): What Is It?
For those that aren't sure what ROCE is, it measures the amount of pre-tax profits a company can generate from the capital employed in its business. Analysts use this formula to calculate it for Eonmetall Group Berhad:
Return on Capital Employed = Earnings Before Interest and Tax (EBIT) ÷ (Total Assets - Current Liabilities)
0.0091 = RM3.2m ÷ (RM521m - RM167m) (Based on the trailing twelve months to December 2023).
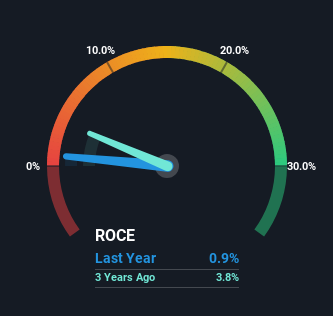
So, Eonmetall Group Berhad has an ROCE of 0.9%. In absolute terms, that's a low return and it also under-performs the Metals and Mining industry average of 5.8%.
View our latest analysis for Eonmetall Group Berhad
While the past is not representative of the future, it can be helpful to know how a company has performed historically, which is why we have this chart above. If you'd like to look at how Eonmetall Group Berhad has performed in the past in other metrics, you can view this free graph of Eonmetall Group Berhad's past earnings, revenue and cash flow.
The Trend Of ROCE
When we looked at the ROCE trend at Eonmetall Group Berhad, we didn't gain much confidence. Over the last five years, returns on capital have decreased to 0.9% from 3.3% five years ago. And considering revenue has dropped while employing more capital, we'd be cautious. This could mean that the business is losing its competitive advantage or market share, because while more money is being put into ventures, it's actually producing a lower return - "less bang for their buck" per se.
The Bottom Line On Eonmetall Group Berhad's ROCE
From the above analysis, we find it rather worrisome that returns on capital and sales for Eonmetall Group Berhad have fallen, meanwhile the business is employing more capital than it was five years ago. Investors must expect better things on the horizon though because the stock has risen 7.1% in the last five years. Either way, we aren't huge fans of the current trends and so with that we think you might find better investments elsewhere.
On a final note, we found 3 warning signs for Eonmetall Group Berhad (2 shouldn't be ignored) you should be aware of.
While Eonmetall Group Berhad isn't earning the highest return, check out this free list of companies that are earning high returns on equity with solid balance sheets.
Have feedback on this article? Concerned about the content? Get in touch with us directly. Alternatively, email editorial-team (at) simplywallst.com.
This article by Simply Wall St is general in nature. We provide commentary based on historical data and analyst forecasts only using an unbiased methodology and our articles are not intended to be financial advice. It does not constitute a recommendation to buy or sell any stock, and does not take account of your objectives, or your financial situation. We aim to bring you long-term focused analysis driven by fundamental data. Note that our analysis may not factor in the latest price-sensitive company announcements or qualitative material. Simply Wall St has no position in any stocks mentioned.
