
G1 Therapeutics (NASDAQ:GTHX) Shareholders Are up 68% This Past Week, but Still in the Red Over the Last Three Years
G1 Therapeutics (NASDAQ:GTHX) Shareholders Are up 68% This Past Week, but Still in the Red Over the Last Three Years
It is doubtless a positive to see that the G1 Therapeutics, Inc. (NASDAQ:GTHX) share price has gained some 87% in the last three months. But only the myopic could ignore the astounding decline over three years. In that time the share price has melted like a snowball in the desert, down 82%. So it's about time shareholders saw some gains. Of course the real question is whether the business can sustain a turnaround. While a drop like that is definitely a body blow, money isn't as important as health and happiness.
毫無疑問,G1 Therapeutics, Inc.(納斯達克股票代碼:GTHX)的股價在過去三個月中上漲了約87%,這是一個積極因素。但是,只有近視者才能忽視三年來的驚人下降。在那段時間裏,股價像沙漠中的滾雪球一樣融化,下跌了82%。因此,現在是股東看到一些收益的時候了。當然,真正的問題是企業能否維持轉機。雖然這樣的下降絕對是沉重的打擊,但金錢並不像健康和幸福那麼重要。
The recent uptick of 68% could be a positive sign of things to come, so let's take a look at historical fundamentals.
最近上漲68%可能是即將發生的事情的積極信號,因此讓我們來看一下歷史基本面。
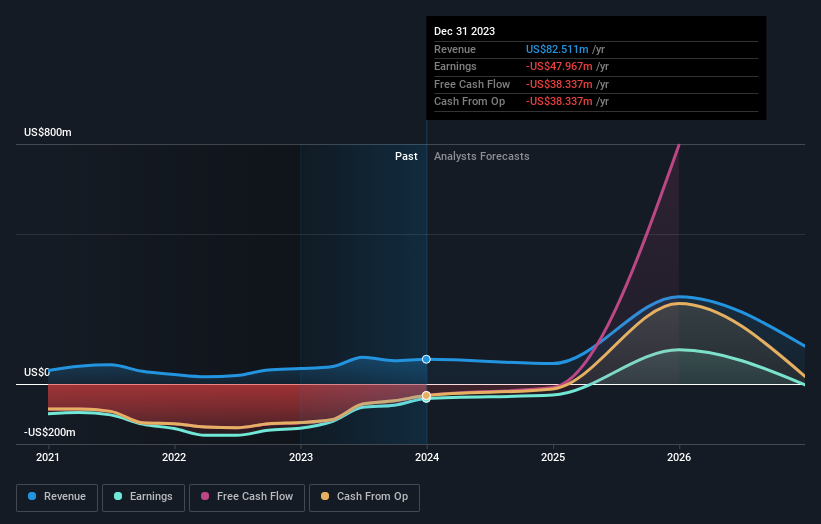
G1 Therapeutics wasn't profitable in the last twelve months, it is unlikely we'll see a strong correlation between its share price and its earnings per share (EPS). Arguably revenue is our next best option. Shareholders of unprofitable companies usually expect strong revenue growth. That's because it's hard to be confident a company will be sustainable if revenue growth is negligible, and it never makes a profit.
G1 Therapeutics在過去十二個月中沒有盈利,我們不太可能看到其股價與每股收益(EPS)之間存在很強的相關性。可以說,收入是我們的下一個最佳選擇。無利可圖的公司的股東通常期望強勁的收入增長。那是因爲如果收入增長可以忽略不計,而且從不盈利,就很難確信一家公司能否實現可持續發展。
In the last three years, G1 Therapeutics saw its revenue grow by 21% per year, compound. That is faster than most pre-profit companies. So on the face of it we're really surprised to see the share price down 22% a year in the same time period. The share price makes us wonder if there is an issue with profitability. Sometimes fast revenue growth doesn't lead to profits. If the company is low on cash, it may have to raise capital soon.
在過去的三年中,G1 Therapeutics的收入每年增長21%,複合增長。這比大多數盈利前公司要快。因此,從表面上看,看到同期股價每年下跌22%,我們感到非常驚訝。股價讓我們懷疑盈利能力是否存在問題。有時,快速的收入增長並不能帶來利潤。如果公司現金不足,則可能必須儘快籌集資金。
The graphic below depicts how earnings and revenue have changed over time (unveil the exact values by clicking on the image).
下圖描述了收入和收入隨時間推移而發生的變化(點擊圖片即可顯示確切的數值)。
You can see how its balance sheet has strengthened (or weakened) over time in this free interactive graphic.
您可以在這張免費的交互式圖片中看到其資產負債表如何隨着時間的推移而增強(或減弱)。
A Different Perspective
不同的視角
G1 Therapeutics shareholders are down 1.8% for the year, but the market itself is up 26%. However, keep in mind that even the best stocks will sometimes underperform the market over a twelve month period. However, the loss over the last year isn't as bad as the 12% per annum loss investors have suffered over the last half decade. We would want clear information suggesting the company will grow, before taking the view that the share price will stabilize. It's always interesting to track share price performance over the longer term. But to understand G1 Therapeutics better, we need to consider many other factors. To that end, you should learn about the 2 warning signs we've spotted with G1 Therapeutics (including 1 which is significant) .
G1 Therapeutics的股東今年下跌了1.8%,但市場本身上漲了26%。但是,請記住,即使是最好的股票有時也會在十二個月內表現不如市場。但是,去年的虧損沒有投資者在過去五年中遭受的每年12%的損失那麼嚴重。在認爲股價將穩定之前,我們希望獲得明確的信息,表明該公司將增長。長期跟蹤股價表現總是很有意思的。但是,爲了更好地了解G1療法,我們需要考慮許多其他因素。爲此,你應該了解我們在G1 Therapeutics中發現的兩個警告信號(包括一個重要的警告信號)。
If you like to buy stocks alongside management, then you might just love this free list of companies. (Hint: insiders have been buying them).
如果你想與管理層一起購買股票,那麼你可能會喜歡這份免費的公司名單。(提示:業內人士一直在購買它們)。
Please note, the market returns quoted in this article reflect the market weighted average returns of stocks that currently trade on American exchanges.
請注意,本文引用的市場回報反映了目前在美國交易所交易的股票的市場加權平均回報。
Have feedback on this article? Concerned about the content? Get in touch with us directly. Alternatively, email editorial-team (at) simplywallst.com.
This article by Simply Wall St is general in nature. We provide commentary based on historical data and analyst forecasts only using an unbiased methodology and our articles are not intended to be financial advice. It does not constitute a recommendation to buy or sell any stock, and does not take account of your objectives, or your financial situation. We aim to bring you long-term focused analysis driven by fundamental data. Note that our analysis may not factor in the latest price-sensitive company announcements or qualitative material. Simply Wall St has no position in any stocks mentioned.
對這篇文章有反饋嗎?對內容感到擔憂?直接聯繫我們。 或者,給編輯團隊 (at) simplywallst.com 發送電子郵件。
Simply Wall St的這篇文章本質上是籠統的。我們僅使用公正的方法根據歷史數據和分析師的預測提供評論,我們的文章無意作爲財務建議。它不構成買入或賣出任何股票的建議,也沒有考慮到您的目標或財務狀況。我們的目標是爲您提供由基本數據驅動的長期重點分析。請注意,我們的分析可能不考慮最新的價格敏感型公司公告或定性材料。簡而言之,華爾街沒有持有任何上述股票的頭寸。
譯文內容由第三人軟體翻譯。