
 Yahoo Finance
 Returns On Capital At Adecco Group (VTX:ADEN) Paint A Concerning Picture
If we want to find a potential multi-bagger, often there are underlying trends that can provide clues. Typically, we'll want to notice a trend of growing return on capital employed (ROCE) and alongside that, an expanding base of capital employed. If you see this, it typically means it's a company with a great business model and plenty of profitable reinvestment opportunities. Although, when we looked at Adecco Group (VTX:ADEN), it didn't seem to tick all of these boxes.
What Is Return On Capital Employed (ROCE)?
For those that aren't sure what ROCE is, it measures the amount of pre-tax profits a company can generate from the capital employed in its business. Analysts use this formula to calculate it for Adecco Group:
Return on Capital Employed = Earnings Before Interest and Tax (EBIT) ÷ (Total Assets - Current Liabilities)
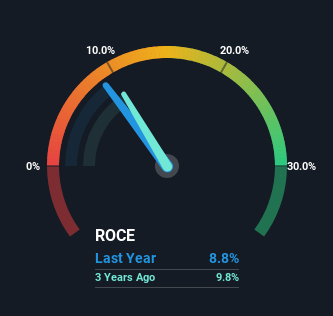
0.088 = €687m ÷ (€13b - €4.9b) (Based on the trailing twelve months to September 2023).
So, Adecco Group has an ROCE of 8.8%. In absolute terms, that's a low return and it also under-performs the Professional Services industry average of 13%.
Check out our latest analysis for Adecco Group
In the above chart we have measured Adecco Group's prior ROCE against its prior performance, but the future is arguably more important. If you're interested, you can view the analysts predictions in our free analyst report for Adecco Group .
What Does the ROCE Trend For Adecco Group Tell Us?
In terms of Adecco Group's historical ROCE movements, the trend isn't fantastic. Over the last five years, returns on capital have decreased to 8.8% from 17% five years ago. Meanwhile, the business is utilizing more capital but this hasn't moved the needle much in terms of sales in the past 12 months, so this could reflect longer term investments. It may take some time before the company starts to see any change in earnings from these investments.
The Bottom Line
In summary, Adecco Group is reinvesting funds back into the business for growth but unfortunately it looks like sales haven't increased much just yet. Additionally, the stock's total return to shareholders over the last five years has been flat, which isn't too surprising. Therefore based on the analysis done in this article, we don't think Adecco Group has the makings of a multi-bagger.
Like most companies, Adecco Group does come with some risks, and we've found 4 warning signs that you should be aware of.
While Adecco Group isn't earning the highest return, check out this free list of companies that are earning high returns on equity with solid balance sheets.
Have feedback on this article? Concerned about the content? Get in touch with us directly. Alternatively, email editorial-team (at) simplywallst.com.
This article by Simply Wall St is general in nature. We provide commentary based on historical data and analyst forecasts only using an unbiased methodology and our articles are not intended to be financial advice. It does not constitute a recommendation to buy or sell any stock, and does not take account of your objectives, or your financial situation. We aim to bring you long-term focused analysis driven by fundamental data. Note that our analysis may not factor in the latest price-sensitive company announcements or qualitative material. Simply Wall St has no position in any stocks mentioned.
