
A Look At The Intrinsic Value Of Hangzhou Greenda Electronic Materials Co., Ltd. (SHSE:603931)
A Look At The Intrinsic Value Of Hangzhou Greenda Electronic Materials Co., Ltd. (SHSE:603931)
Key Insights
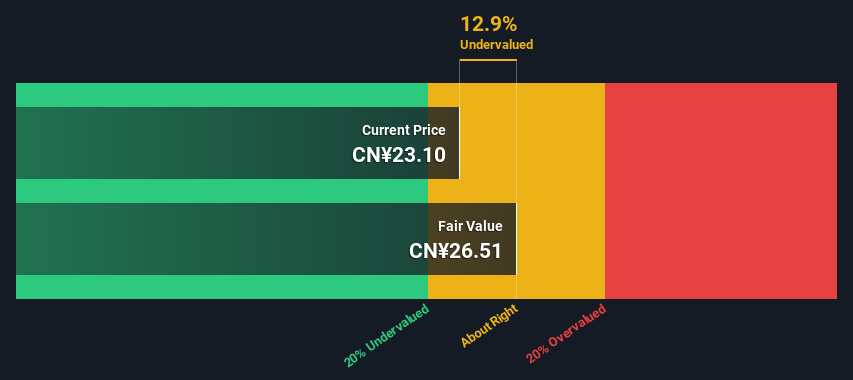
- Using the 2 Stage Free Cash Flow to Equity, Hangzhou Greenda Electronic Materials fair value estimate is CN¥26.51
- With CN¥23.10 share price, Hangzhou Greenda Electronic Materials appears to be trading close to its estimated fair value
- Hangzhou Greenda Electronic Materials' peers are currently trading at a premium of 219% on average
Does the February share price for Hangzhou Greenda Electronic Materials Co., Ltd. (SHSE:603931) reflect what it's really worth? Today, we will estimate the stock's intrinsic value by estimating the company's future cash flows and discounting them to their present value. The Discounted Cash Flow (DCF) model is the tool we will apply to do this. There's really not all that much to it, even though it might appear quite complex.
Remember though, that there are many ways to estimate a company's value, and a DCF is just one method. For those who are keen learners of equity analysis, the Simply Wall St analysis model here may be something of interest to you.
The Model
We're using the 2-stage growth model, which simply means we take in account two stages of company's growth. In the initial period the company may have a higher growth rate and the second stage is usually assumed to have a stable growth rate. In the first stage we need to estimate the cash flows to the business over the next ten years. Seeing as no analyst estimates of free cash flow are available to us, we have extrapolate the previous free cash flow (FCF) from the company's last reported value. We assume companies with shrinking free cash flow will slow their rate of shrinkage, and that companies with growing free cash flow will see their growth rate slow, over this period. We do this to reflect that growth tends to slow more in the early years than it does in later years.
Generally we assume that a dollar today is more valuable than a dollar in the future, so we discount the value of these future cash flows to their estimated value in today's dollars:
10-year free cash flow (FCF) forecast
| 2024 | 2025 | 2026 | 2027 | 2028 | 2029 | 2030 | 2031 | 2032 | 2033 | |
| Levered FCF (CN¥, Millions) | CN¥146.1m | CN¥187.8m | CN¥227.0m | CN¥262.2m | CN¥292.9m | CN¥319.5m | CN¥342.6m | CN¥363.0m | CN¥381.4m | CN¥398.2m |
| Growth Rate Estimate Source | Est @ 39.50% | Est @ 28.53% | Est @ 20.86% | Est @ 15.48% | Est @ 11.72% | Est @ 9.09% | Est @ 7.24% | Est @ 5.95% | Est @ 5.05% | Est @ 4.42% |
| Present Value (CN¥, Millions) Discounted @ 8.3% | CN¥135 | CN¥160 | CN¥179 | CN¥191 | CN¥197 | CN¥198 | CN¥196 | CN¥192 | CN¥187 | CN¥180 |
("Est" = FCF growth rate estimated by Simply Wall St)
Present Value of 10-year Cash Flow (PVCF) = CN¥1.8b
The second stage is also known as Terminal Value, this is the business's cash flow after the first stage. For a number of reasons a very conservative growth rate is used that cannot exceed that of a country's GDP growth. In this case we have used the 5-year average of the 10-year government bond yield (2.9%) to estimate future growth. In the same way as with the 10-year 'growth' period, we discount future cash flows to today's value, using a cost of equity of 8.3%.
Terminal Value (TV)= FCF2033 × (1 + g) ÷ (r – g) = CN¥398m× (1 + 2.9%) ÷ (8.3%– 2.9%) = CN¥7.7b
Present Value of Terminal Value (PVTV)= TV / (1 + r)10= CN¥7.7b÷ ( 1 + 8.3%)10= CN¥3.5b
The total value is the sum of cash flows for the next ten years plus the discounted terminal value, which results in the Total Equity Value, which in this case is CN¥5.3b. The last step is to then divide the equity value by the number of shares outstanding. Relative to the current share price of CN¥23.1, the company appears about fair value at a 13% discount to where the stock price trades currently. Valuations are imprecise instruments though, rather like a telescope - move a few degrees and end up in a different galaxy. Do keep this in mind.
Important Assumptions
We would point out that the most important inputs to a discounted cash flow are the discount rate and of course the actual cash flows. If you don't agree with these result, have a go at the calculation yourself and play with the assumptions. The DCF also does not consider the possible cyclicality of an industry, or a company's future capital requirements, so it does not give a full picture of a company's potential performance. Given that we are looking at Hangzhou Greenda Electronic Materials as potential shareholders, the cost of equity is used as the discount rate, rather than the cost of capital (or weighted average cost of capital, WACC) which accounts for debt. In this calculation we've used 8.3%, which is based on a levered beta of 0.947. Beta is a measure of a stock's volatility, compared to the market as a whole. We get our beta from the industry average beta of globally comparable companies, with an imposed limit between 0.8 and 2.0, which is a reasonable range for a stable business.
SWOT Analysis for Hangzhou Greenda Electronic Materials
- Currently debt free.
- Dividends are covered by earnings and cash flows.
- Dividend information for 603931.
- Earnings declined over the past year.
- Dividend is low compared to the top 25% of dividend payers in the Chemicals market.
- Key risks with investing in 603931.
- Current share price is below our estimate of fair value.
- Lack of analyst coverage makes it difficult to determine 603931's earnings prospects.
- No apparent threats visible for 603931.
Looking Ahead:
Valuation is only one side of the coin in terms of building your investment thesis, and it is only one of many factors that you need to assess for a company. It's not possible to obtain a foolproof valuation with a DCF model. Rather it should be seen as a guide to "what assumptions need to be true for this stock to be under/overvalued?" If a company grows at a different rate, or if its cost of equity or risk free rate changes sharply, the output can look very different. For Hangzhou Greenda Electronic Materials, we've compiled three pertinent items you should further examine:
- Risks: For instance, we've identified 1 warning sign for Hangzhou Greenda Electronic Materials that you should be aware of.
- Other Solid Businesses: Low debt, high returns on equity and good past performance are fundamental to a strong business. Why not explore our interactive list of stocks with solid business fundamentals to see if there are other companies you may not have considered!
- Other Environmentally-Friendly Companies: Concerned about the environment and think consumers will buy eco-friendly products more and more? Browse through our interactive list of companies that are thinking about a greener future to discover some stocks you may not have thought of!
PS. The Simply Wall St app conducts a discounted cash flow valuation for every stock on the SHSE every day. If you want to find the calculation for other stocks just search here.
Have feedback on this article? Concerned about the content? Get in touch with us directly. Alternatively, email editorial-team (at) simplywallst.com.
This article by Simply Wall St is general in nature. We provide commentary based on historical data and analyst forecasts only using an unbiased methodology and our articles are not intended to be financial advice. It does not constitute a recommendation to buy or sell any stock, and does not take account of your objectives, or your financial situation. We aim to bring you long-term focused analysis driven by fundamental data. Note that our analysis may not factor in the latest price-sensitive company announcements or qualitative material. Simply Wall St has no position in any stocks mentioned.
關鍵見解
- 使用兩階段自由現金流股權,杭州格林達電子材料的公允價值估計爲26.51元人民幣
- 杭州格林達電子材料的股價爲23.10元人民幣,其交易價格似乎接近其估計的公允價值
- 杭州格林達電子材料的同行目前的平均溢價爲219%
杭州格林達電子材料有限公司(SHSE: 603931)2月份的股價是否反映了其真正價值?今天,我們將通過估算公司未來的現金流並將其折現爲現值來估算股票的內在價值。折扣現金流(DCF)模型是我們將應用的工具。儘管它可能看起來很複雜,但實際上並沒有那麼多。
但請記住,估算公司價值的方法有很多,而差價合約只是一種方法。對於那些熱衷於股票分析的人來說,你可能會對這裏的Simply Wall St分析模型感興趣。
該模型
我們使用的是兩階段增長模型,這只是意味着我們考慮了公司增長的兩個階段。在初始階段,公司的增長率可能更高,而第二階段通常被認爲具有穩定的增長率。在第一階段,我們需要估算未來十年的業務現金流。鑑於我們沒有分析師對自由現金流的估計,我們從公司上次公佈的價值中推斷了之前的自由現金流(FCF)。我們假設自由現金流萎縮的公司將減緩其萎縮速度,而自由現金流不斷增長的公司在此期間的增長率將放緩。我們這樣做是爲了反映早期增長的放緩幅度往往比後來的幾年更大。
通常,我們假設今天的一美元比未來一美元更有價值,因此我們將這些未來現金流的價值折現爲以今天的美元計算的估計價值:
10 年自由現金流 (FCF) 預測
| 2024 | 2025 | 2026 | 2027 | 2028 | 2029 | 2030 | 2031 | 2032 | 2033 | |
| 槓桿FCF(人民幣,百萬) | 1.461 億元人民幣 | 1.878 億元人民幣 | 2.270 億元人民幣 | 262.2 億元人民幣 | 29290 萬元人民幣 | 319.5 億元人民幣 | 3.426億人民幣 | 363.0 億元人民幣 | 38140 萬元人民幣 | 398.2 萬人民幣 |
| 增長率估算來源 | 美國東部標準時間 @ 39.50% | 美國東部標準時間 @ 28.53% | 美國東部標準時間 @ 20.86% | 美國東部標準時間 @ 15.48% | Est @ 11.72% | 美國東部標準時間 @ 9.09% | Est @ 7.24% | 美國東部時間 @ 5.95% | Est @ 5.05% | 美國東部標準時間 @ 4.42% |
| 現值(人民幣,百萬元)折扣 @ 8.3% | CN¥135 | CN¥160 | CN¥179 | CN¥191 | CN¥197 | 人民幣198 | CN¥196 | CN¥192 | 人民幣187元 | CN¥180 |
(“Est” = Simply Wall St估計的FCF增長率)
10 年期現金流 (PVCF) 的現值 = 18 億元人民幣
第二階段也稱爲終值,這是企業在第一階段之後的現金流。出於多種原因,使用的增長率非常保守,不能超過一個國家的GDP增長率。在這種情況下,我們使用10年期國債收益率的5年平均值(2.9%)來估計未來的增長。與10年 “增長” 期一樣,我們使用8.3%的股本成本將未來的現金流折現爲今天的價值。
終端價值 (TV) = FCF2033 × (1 + g) ÷ (r — g) = 3.98億元人民幣× (1 + 2.9%) ÷ (8.3% — 2.9%) = 77億元人民幣
終端價值的現值 (PVTV) = 電視/ (1 + r)10= CN¥7.7b÷ (1 + 8.3%)10= cn¥35b
總價值是未來十年的現金流總額加上折後的終端價值,由此得出總權益價值,在本例中爲53億元人民幣。最後一步是將股票價值除以已發行股票的數量。相對於目前的23.1元人民幣的股價,該公司的公允價值似乎比目前的股價折扣了13%。但是,估值是不精確的工具,就像望遠鏡一樣——移動幾度,最終進入另一個星系。請記住這一點。
重要假設
我們要指出的是,貼現現金流的最重要投入是貼現率,當然還有實際的現金流。如果你不同意這些結果,那就自己計算一下,試一試假設。DCF也沒有考慮一個行業可能的週期性,也沒有考慮公司未來的資本需求,因此它沒有全面反映公司的潛在表現。鑑於我們將杭州格林達電子材料視爲潛在股東,因此使用權益成本作爲貼現率,而不是構成債務的資本成本(或加權平均資本成本,WACC)。在此計算中,我們使用了8.3%,這是基於0.947的槓桿測試版。Beta是衡量股票與整個市場相比波動性的指標。我們的測試版來自全球可比公司的行業平均貝塔值,設定在0.8到2.0之間,這是一個穩定的業務的合理範圍。
杭州格林達電子材料的SWOT分析
- 目前無債務。
- 股息由收益和現金流支付。
- 603931 的股息信息。
- 在過去的一年中,收益有所下降。
- 與化工市場前25%的股息支付者相比,股息很低。
- 投資603931的主要風險。
- 目前的股價低於我們對公允價值的估計。
- 由於缺乏分析師的報道,因此很難確定603931的收益前景。
- 603931 沒有明顯的威脅可見。
展望未來:
就建立投資論點而言,估值只是硬幣的一面,它只是公司需要評估的衆多因素之一。使用DCF模型不可能獲得萬無一失的估值。相反,它應該被視爲 “需要哪些假設才能低估/高估這隻股票的價值?” 的指南如果一家公司以不同的速度增長,或者其股本成本或無風險利率急劇變化,則產出可能會大不相同。對於杭州格林達電子材料,我們整理了三個相關項目,您應該進一步研究:
- 風險:例如,我們已經確定了杭州格林達電子材料的一個警告標誌,你應該注意這一點。
- 其他穩健的業務:低債務、高股本回報率和良好的過去表現是強大業務的基礎。爲什麼不瀏覽我們具有堅實業務基礎的股票互動清單,看看是否還有其他你可能沒有考慮過的公司!
- 其他環保公司:擔心環境並認爲消費者會越來越多地購買環保產品?瀏覽我們正在考慮更綠色未來的公司的互動名單,發現一些你可能沒有想到的股票!
PS。Simply Wall St應用程序每天對上海證券交易所的每隻股票進行折扣現金流估值。如果您想找到其他股票的計算方法,請在此處搜索。
對這篇文章有反饋嗎?對內容感到擔憂?直接聯繫我們。 或者,給編輯團隊 (at) simplywallst.com 發送電子郵件。
Simply Wall St的這篇文章本質上是籠統的。我們僅使用公正的方法根據歷史數據和分析師的預測提供評論,我們的文章無意作爲財務建議。它不構成買入或賣出任何股票的建議,也沒有考慮到您的目標或財務狀況。我們的目標是爲您提供由基本數據驅動的長期重點分析。請注意,我們的分析可能不考慮最新的價格敏感型公司公告或定性材料。簡而言之,華爾街沒有持有任何上述股票的頭寸。
譯文內容由第三人軟體翻譯。
風險及免責聲明
- 分享到weixin
- 分享到qq
- 分享到facebook
- 分享到twitter
- 分享到微博
- 粘贴板
使用瀏覽器的分享功能,分享給你的好友吧