
 Yahoo Finance
 Econ Healthcare (Asia) (Catalist:EHG) Could Be Struggling To Allocate Capital
What trends should we look for it we want to identify stocks that can multiply in value over the long term? Amongst other things, we'll want to see two things; firstly, a growing return on capital employed (ROCE) and secondly, an expansion in the company's amount of capital employed. If you see this, it typically means it's a company with a great business model and plenty of profitable reinvestment opportunities. In light of that, when we looked at Econ Healthcare (Asia) (Catalist:EHG) and its ROCE trend, we weren't exactly thrilled.
Return On Capital Employed (ROCE): What Is It?
For those that aren't sure what ROCE is, it measures the amount of pre-tax profits a company can generate from the capital employed in its business. The formula for this calculation on Econ Healthcare (Asia) is:
Return on Capital Employed = Earnings Before Interest and Tax (EBIT) ÷ (Total Assets - Current Liabilities)
0.07 = S$4.9m ÷ (S$96m - S$25m) (Based on the trailing twelve months to September 2023).
Therefore, Econ Healthcare (Asia) has an ROCE of 7.0%. On its own that's a low return on capital but it's in line with the industry's average returns of 7.3%.
View our latest analysis for Econ Healthcare (Asia)
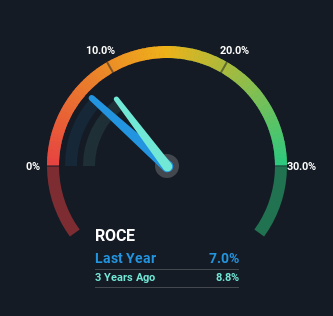
Historical performance is a great place to start when researching a stock so above you can see the gauge for Econ Healthcare (Asia)'s ROCE against it's prior returns. If you're interested in investigating Econ Healthcare (Asia)'s past further, check out this free graph covering Econ Healthcare (Asia)'s past earnings, revenue and cash flow.
What Can We Tell From Econ Healthcare (Asia)'s ROCE Trend?
When we looked at the ROCE trend at Econ Healthcare (Asia), we didn't gain much confidence. To be more specific, ROCE has fallen from 8.8% over the last three years. Although, given both revenue and the amount of assets employed in the business have increased, it could suggest the company is investing in growth, and the extra capital has led to a short-term reduction in ROCE. If these investments prove successful, this can bode very well for long term stock performance.
The Key Takeaway
Even though returns on capital have fallen in the short term, we find it promising that revenue and capital employed have both increased for Econ Healthcare (Asia). Furthermore the stock has climbed 16% over the last year, it would appear that investors are upbeat about the future. So should these growth trends continue, we'd be optimistic on the stock going forward.
If you want to know some of the risks facing Econ Healthcare (Asia) we've found 3 warning signs (1 shouldn't be ignored!) that you should be aware of before investing here.
For those who like to invest in solid companies, check out this free list of companies with solid balance sheets and high returns on equity.
Have feedback on this article? Concerned about the content? Get in touch with us directly. Alternatively, email editorial-team (at) simplywallst.com.
This article by Simply Wall St is general in nature. We provide commentary based on historical data and analyst forecasts only using an unbiased methodology and our articles are not intended to be financial advice. It does not constitute a recommendation to buy or sell any stock, and does not take account of your objectives, or your financial situation. We aim to bring you long-term focused analysis driven by fundamental data. Note that our analysis may not factor in the latest price-sensitive company announcements or qualitative material. Simply Wall St has no position in any stocks mentioned.
