
Returns On Capital At ReNew Energy Global (NASDAQ:RNW) Have Hit The Brakes
Returns On Capital At ReNew Energy Global (NASDAQ:RNW) Have Hit The Brakes
If we want to find a potential multi-bagger, often there are underlying trends that can provide clues. One common approach is to try and find a company with returns on capital employed (ROCE) that are increasing, in conjunction with a growing amount of capital employed. This shows us that it's a compounding machine, able to continually reinvest its earnings back into the business and generate higher returns. Having said that, from a first glance at ReNew Energy Global (NASDAQ:RNW) we aren't jumping out of our chairs at how returns are trending, but let's have a deeper look.
如果我們想找到潛在的多袋裝袋機,通常有一些潛在的趨勢可以提供線索。一種常見的方法是嘗試找一家公司 回報 論資本使用率(ROCE)在增加的同時增長 金額 所用資本的比例。這向我們表明,它是一臺複合機器,能夠持續將其收益再投資到業務中併產生更高的回報。話雖如此,乍一看Renew Energy Global(納斯達克股票代碼:RNW),我們並不是對回報趨勢不屑一顧,但讓我們更深入地了解一下。
Understanding Return On Capital Employed (ROCE)
了解資本使用回報率 (ROCE)
For those who don't know, ROCE is a measure of a company's yearly pre-tax profit (its return), relative to the capital employed in the business. To calculate this metric for ReNew Energy Global, this is the formula:
對於那些不知道的人,投資回報率是衡量公司相對於業務所用資本的年度稅前利潤(其回報)的指標。要計算 Renew Energy Global 的這個指標,公式如下:
Return on Capital Employed = Earnings Before Interest and Tax (EBIT) ÷ (Total Assets - Current Liabilities)
已動用資本回報率 = 息稅前收益 (EBIT) ¥(總資產-流動負債)
0.063 = ₹45b ÷ (₹887b - ₹165b) (Based on the trailing twelve months to December 2023).
0.063 = 450億盧比 ÷(887億盧比-165億盧比) (基於截至2023年12月的過去十二個月)。
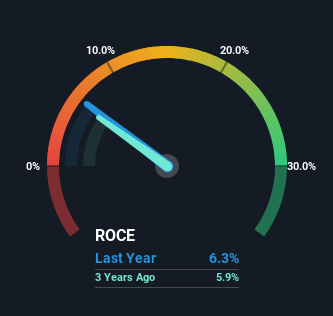
Thus, ReNew Energy Global has an ROCE of 6.3%. In absolute terms, that's a low return, but it's much better than the Renewable Energy industry average of 3.2%.
因此,ReneW Energy Global的投資回報率爲6.3%。從絕對值來看,這是一個低迴報,但比可再生能源行業3.2%的平均水平要好得多。
In the above chart we have measured ReNew Energy Global's prior ROCE against its prior performance, but the future is arguably more important. If you're interested, you can view the analysts predictions in our free analyst report for ReNew Energy Global .
在上圖中,我們將Renew Energy Global先前的投資回報率與之前的表現進行了比較,但可以說,未來更爲重要。如果你有興趣,可以在我們的Renew Energy Global免費分析師報告中查看分析師的預測。
What Can We Tell From ReNew Energy Global's ROCE Trend?
我們可以從ReneW Energy Global的投資回報率趨勢中看出什麼?
There are better returns on capital out there than what we're seeing at ReNew Energy Global. Over the past five years, ROCE has remained relatively flat at around 6.3% and the business has deployed 112% more capital into its operations. This poor ROCE doesn't inspire confidence right now, and with the increase in capital employed, it's evident that the business isn't deploying the funds into high return investments.
那裏的資本回報比我們在ReneW Energy Global看到的要好。在過去五年中,投資回報率一直相對持平,約爲6.3%,該業務在運營中投入的資金增加了112%。這種糟糕的投資回報率目前並不能激發信心,隨着所用資本的增加,很明顯,該企業沒有將資金部署到高回報的投資中。
The Key Takeaway
關鍵要點
In summary, ReNew Energy Global has simply been reinvesting capital and generating the same low rate of return as before. And investors appear hesitant that the trends will pick up because the stock has fallen 46% in the last three years. Therefore based on the analysis done in this article, we don't think ReNew Energy Global has the makings of a multi-bagger.
總而言之,Renew Energy Global只是在對資本進行再投資,併產生了與以前一樣低的回報率。投資者似乎對趨勢能否回升猶豫不決,因爲該股在過去三年中下跌了46%。因此,根據本文中的分析,我們認爲Renew Energy Global不具備多袋裝機的優勢。
On a final note, we found 2 warning signs for ReNew Energy Global (1 is concerning) you should be aware of.
最後,我們發現了ReneW Energy Global的兩個警告信號(其中一個令人擔憂),你應該注意。
While ReNew Energy Global isn't earning the highest return, check out this free list of companies that are earning high returns on equity with solid balance sheets.
儘管Renew Energy Global的回報率並不高,但請查看這份免費的股票回報率高、資產負債表穩健的公司名單。
Have feedback on this article? Concerned about the content? Get in touch with us directly. Alternatively, email editorial-team (at) simplywallst.com.
This article by Simply Wall St is general in nature. We provide commentary based on historical data and analyst forecasts only using an unbiased methodology and our articles are not intended to be financial advice. It does not constitute a recommendation to buy or sell any stock, and does not take account of your objectives, or your financial situation. We aim to bring you long-term focused analysis driven by fundamental data. Note that our analysis may not factor in the latest price-sensitive company announcements or qualitative material. Simply Wall St has no position in any stocks mentioned.
對這篇文章有反饋嗎?對內容感到擔憂?直接聯繫我們。 或者,給編輯團隊 (at) simplywallst.com 發送電子郵件。
Simply Wall St的這篇文章本質上是籠統的。我們僅使用公正的方法根據歷史數據和分析師的預測提供評論,我們的文章無意作爲財務建議。它不構成買入或賣出任何股票的建議,也沒有考慮到您的目標或財務狀況。我們的目標是爲您提供由基本數據驅動的長期重點分析。請注意,我們的分析可能不考慮最新的價格敏感型公司公告或定性材料。簡而言之,華爾街沒有持有任何上述股票的頭寸。
譯文內容由第三人軟體翻譯。