
 Yahoo Finance
 Returns At Vsolar Group Berhad (KLSE:VSOLAR) Are On The Way Up
If you're looking for a multi-bagger, there's a few things to keep an eye out for. Firstly, we'd want to identify a growing return on capital employed (ROCE) and then alongside that, an ever-increasing base of capital employed. This shows us that it's a compounding machine, able to continually reinvest its earnings back into the business and generate higher returns. So when we looked at Vsolar Group Berhad (KLSE:VSOLAR) and its trend of ROCE, we really liked what we saw.
Understanding Return On Capital Employed (ROCE)
For those that aren't sure what ROCE is, it measures the amount of pre-tax profits a company can generate from the capital employed in its business. To calculate this metric for Vsolar Group Berhad, this is the formula:
Return on Capital Employed = Earnings Before Interest and Tax (EBIT) ÷ (Total Assets - Current Liabilities)
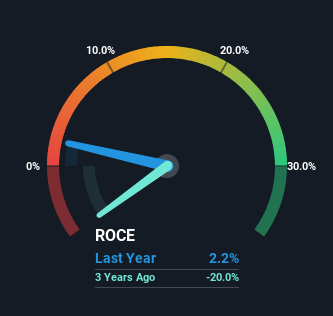
0.022 = RM1.9m ÷ (RM99m - RM8.6m) (Based on the trailing twelve months to September 2023).
So, Vsolar Group Berhad has an ROCE of 2.2%. In absolute terms, that's a low return and it also under-performs the Electronic industry average of 13%.
Check out our latest analysis for Vsolar Group Berhad
While the past is not representative of the future, it can be helpful to know how a company has performed historically, which is why we have this chart above. If you want to delve into the historical earnings, revenue and cash flow of Vsolar Group Berhad, check out these free graphs here.
So How Is Vsolar Group Berhad's ROCE Trending?
We're delighted to see that Vsolar Group Berhad is reaping rewards from its investments and is now generating some pre-tax profits. Shareholders would no doubt be pleased with this because the business was loss-making five years ago but is is now generating 2.2% on its capital. In addition to that, Vsolar Group Berhad is employing 475% more capital than previously which is expected of a company that's trying to break into profitability. This can indicate that there's plenty of opportunities to invest capital internally and at ever higher rates, both common traits of a multi-bagger.
What We Can Learn From Vsolar Group Berhad's ROCE
Long story short, we're delighted to see that Vsolar Group Berhad's reinvestment activities have paid off and the company is now profitable. Although the company may be facing some issues elsewhere since the stock has plunged 97% in the last five years. Still, it's worth doing some further research to see if the trends will continue into the future.
One more thing: We've identified 4 warning signs with Vsolar Group Berhad (at least 3 which don't sit too well with us) , and understanding these would certainly be useful.
For those who like to invest in solid companies, check out this free list of companies with solid balance sheets and high returns on equity.
Have feedback on this article? Concerned about the content? Get in touch with us directly. Alternatively, email editorial-team (at) simplywallst.com.
This article by Simply Wall St is general in nature. We provide commentary based on historical data and analyst forecasts only using an unbiased methodology and our articles are not intended to be financial advice. It does not constitute a recommendation to buy or sell any stock, and does not take account of your objectives, or your financial situation. We aim to bring you long-term focused analysis driven by fundamental data. Note that our analysis may not factor in the latest price-sensitive company announcements or qualitative material. Simply Wall St has no position in any stocks mentioned.
