
 Yahoo Finance
 Be Wary Of Imaspro Corporation Berhad (KLSE:IMASPRO) And Its Returns On Capital
What underlying fundamental trends can indicate that a company might be in decline? When we see a declining return on capital employed (ROCE) in conjunction with a declining base of capital employed, that's often how a mature business shows signs of aging. This indicates to us that the business is not only shrinking the size of its net assets, but its returns are falling as well. Having said that, after a brief look, Imaspro Corporation Berhad (KLSE:IMASPRO) we aren't filled with optimism, but let's investigate further.
What Is Return On Capital Employed (ROCE)?
For those who don't know, ROCE is a measure of a company's yearly pre-tax profit (its return), relative to the capital employed in the business. To calculate this metric for Imaspro Corporation Berhad, this is the formula:
Return on Capital Employed = Earnings Before Interest and Tax (EBIT) ÷ (Total Assets - Current Liabilities)
0.0068 = RM884k ÷ (RM136m - RM6.2m) (Based on the trailing twelve months to September 2023).
So, Imaspro Corporation Berhad has an ROCE of 0.7%. Ultimately, that's a low return and it under-performs the Chemicals industry average of 6.1%.
Check out our latest analysis for Imaspro Corporation Berhad
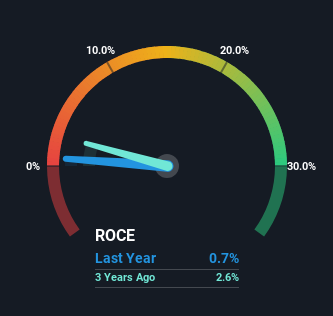
Historical performance is a great place to start when researching a stock so above you can see the gauge for Imaspro Corporation Berhad's ROCE against it's prior returns. If you want to delve into the historical earnings, revenue and cash flow of Imaspro Corporation Berhad, check out these free graphs here.
What The Trend Of ROCE Can Tell Us
In terms of Imaspro Corporation Berhad's historical ROCE movements, the trend doesn't inspire confidence. About five years ago, returns on capital were 6.3%, however they're now substantially lower than that as we saw above. Meanwhile, capital employed in the business has stayed roughly the flat over the period. Companies that exhibit these attributes tend to not be shrinking, but they can be mature and facing pressure on their margins from competition. So because these trends aren't typically conducive to creating a multi-bagger, we wouldn't hold our breath on Imaspro Corporation Berhad becoming one if things continue as they have.
The Key Takeaway
In the end, the trend of lower returns on the same amount of capital isn't typically an indication that we're looking at a growth stock. Investors haven't taken kindly to these developments, since the stock has declined 35% from where it was five years ago. With underlying trends that aren't great in these areas, we'd consider looking elsewhere.
Since virtually every company faces some risks, it's worth knowing what they are, and we've spotted 4 warning signs for Imaspro Corporation Berhad (of which 1 shouldn't be ignored!) that you should know about.
If you want to search for solid companies with great earnings, check out this free list of companies with good balance sheets and impressive returns on equity.
Have feedback on this article? Concerned about the content? Get in touch with us directly. Alternatively, email editorial-team (at) simplywallst.com.
This article by Simply Wall St is general in nature. We provide commentary based on historical data and analyst forecasts only using an unbiased methodology and our articles are not intended to be financial advice. It does not constitute a recommendation to buy or sell any stock, and does not take account of your objectives, or your financial situation. We aim to bring you long-term focused analysis driven by fundamental data. Note that our analysis may not factor in the latest price-sensitive company announcements or qualitative material. Simply Wall St has no position in any stocks mentioned.
