
 Yahoo Finance
 Calamos Strategic Total Return Fund's Dividend Analysis
Understanding CSQ's Dividend Dynamics and Future Sustainability
Calamos Strategic Total Return Fund (NASDAQ:CSQ) recently announced a dividend of $0.1 per share, payable on 2024-02-20, with the ex-dividend date set for 2024-02-09. As investors look forward to this upcoming payment, the spotlight also shines on the company's dividend history, yield, and growth rates. Using the data from GuruFocus, let's look into Calamos Strategic Total Return Fund's dividend performance and assess its sustainability.
What Does Calamos Strategic Total Return Fund Do?
This Powerful Chart Made Peter Lynch 29% A Year For 13 Years
How to calculate the intrinsic value of a stock?
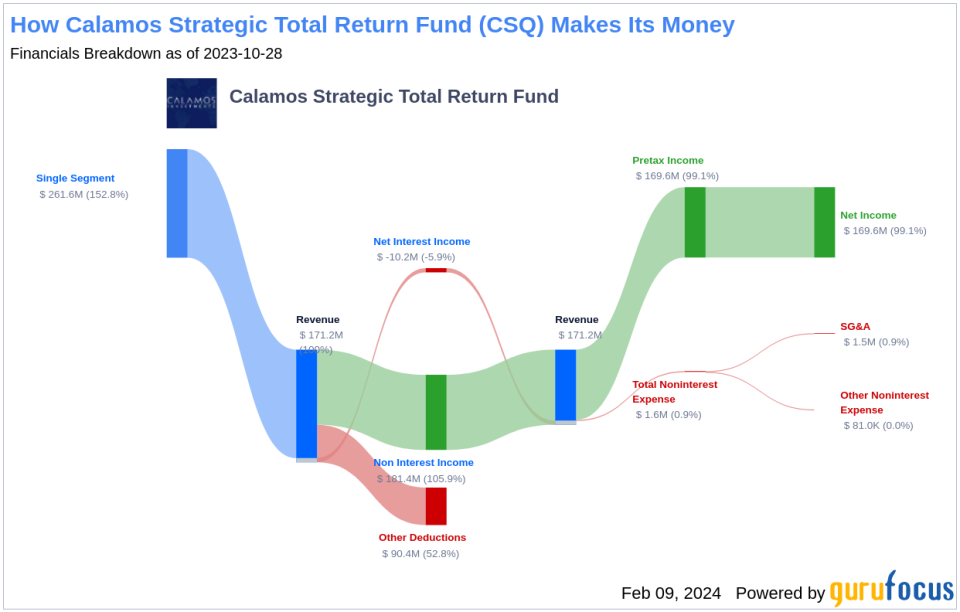
Calamos Strategic Total Return Fund is a diversified, closed-end management investment company. The fund's investment strategy is to provide total return through a combination of capital appreciation and current income. Its investment portfolio consists of equities, convertible securities, and high-yield corporate bonds.
A Glimpse at Calamos Strategic Total Return Fund's Dividend History
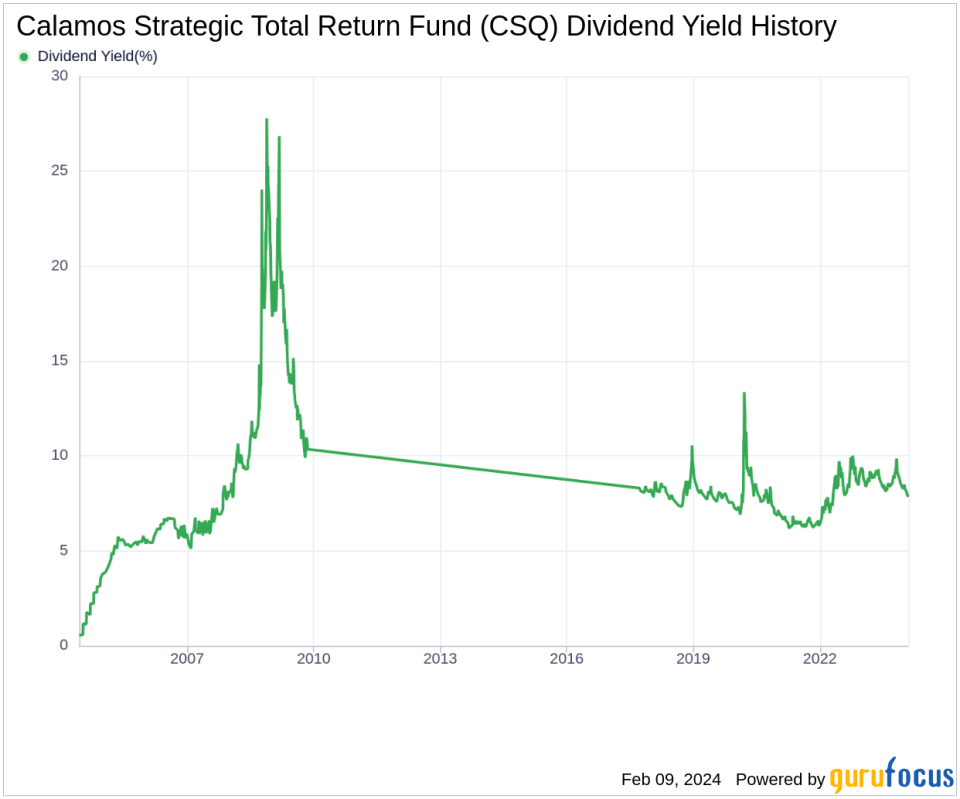
Calamos Strategic Total Return Fund has maintained a consistent dividend payment record since 2004. Dividends are currently distributed on a monthly basis. Below is a chart showing annual Dividends Per Share for tracking historical trends.
Breaking Down Calamos Strategic Total Return Fund's Dividend Yield and Growth
As of today, Calamos Strategic Total Return Fund currently has a 12-month trailing dividend yield of 7.76% and a 12-month forward dividend yield of 7.76%. This suggests an expectation of the same dividend payments over the next 12 months.
Over the past three years, Calamos Strategic Total Return Fund's annual dividend growth rate was 4.10%. Extended to a five-year horizon, this rate increased to 5.40% per year. Based on Calamos Strategic Total Return Fund's dividend yield and five-year growth rate, the 5-year yield on cost of Calamos Strategic Total Return Fund stock as of today is approximately 10.09%.
The Sustainability Question: Payout Ratio and Profitability
To assess the sustainability of the dividend, one needs to evaluate the company's payout ratio. The dividend payout ratio provides insights into the portion of earnings the company distributes as dividends. A lower ratio suggests that the company retains a significant part of its earnings, thereby ensuring the availability of funds for future growth and unexpected downturns. As of 2023-10-31, Calamos Strategic Total Return Fund's dividend payout ratio is 1.15, which may suggest that the company's dividend may not be sustainable.
Calamos Strategic Total Return Fund's profitability rank, offers an understanding of the company's earnings prowess relative to its peers. GuruFocus ranks Calamos Strategic Total Return Fund's profitability 2 out of 10 as of 2023-10-31, suggesting the dividend may not be sustainable. The company has reported net profit in 6 years out of the past 10 years.
Growth Metrics: The Future Outlook
To ensure the sustainability of dividends, a company must have robust growth metrics. Calamos Strategic Total Return Fund's growth rank of 2 out of 10 suggests that the company has poor growth prospects and thus, the dividend may not be sustainable.
Revenue is the lifeblood of any company, and Calamos Strategic Total Return Fund's revenue per share, combined with the 3-year revenue growth rate, indicates a strong revenue model. Calamos Strategic Total Return Fund's revenue has decreased by approximately -9.60% per year on average, a rate that underperforms approximately 69.95% of global competitors.
The company's 3-year EPS growth rate showcases its capability to grow its earnings, a critical component for sustaining dividends in the long run. During the past three years, Calamos Strategic Total Return Fund's earnings decreased by approximately -9.60% per year on average, a rate that underperforms approximately 68.38% of global competitors.
Next Steps
Assessing Calamos Strategic Total Return Fund's dividend payments, dividend growth rate, payout ratio, profitability, and growth metrics presents a nuanced picture. While the fund has a history of consistent dividends and an attractive yield on cost, its growth and profitability ranks cast doubt on the long-term sustainability of its dividend payments. It's essential for investors to weigh these factors and monitor the fund's financial health and market performance closely. GuruFocus Premium users can screen for high-dividend yield stocks using the High Dividend Yield Screener to find potentially more sustainable dividend-paying investments.
This article, generated by GuruFocus, is designed to provide general insights and is not tailored financial advice. Our commentary is rooted in historical data and analyst projections, utilizing an impartial methodology, and is not intended to serve as specific investment guidance. It does not formulate a recommendation to purchase or divest any stock and does not consider individual investment objectives or financial circumstances. Our objective is to deliver long-term, fundamental data-driven analysis. Be aware that our analysis might not incorporate the most recent, price-sensitive company announcements or qualitative information. GuruFocus holds no position in the stocks mentioned herein.
This article first appeared on GuruFocus.
