
John B. Sanfilippo & Son (NASDAQ:JBSS) Sheds 6.5% This Week, as Yearly Returns Fall More in Line With Earnings Growth
John B. Sanfilippo & Son (NASDAQ:JBSS) Sheds 6.5% This Week, as Yearly Returns Fall More in Line With Earnings Growth
When you buy and hold a stock for the long term, you definitely want it to provide a positive return. But more than that, you probably want to see it rise more than the market average. But John B. Sanfilippo & Son, Inc. (NASDAQ:JBSS) has fallen short of that second goal, with a share price rise of 42% over five years, which is below the market return. Looking at the last year alone, the stock is up 8.9%.
当你长期购买和持有股票时,你肯定希望它能提供正回报。但不仅如此,你可能希望看到它的涨幅超过市场平均水平。但是约翰·B·桑菲利波父子公司(纳斯达克股票代码:JBSS)尚未实现第二个目标,股价在五年内上涨了42%,低于市场回报率。仅从去年来看,该股就上涨了8.9%。
In light of the stock dropping 6.5% in the past week, we want to investigate the longer term story, and see if fundamentals have been the driver of the company's positive five-year return.
鉴于该股在过去一周下跌了6.5%,我们想调查长期情况,看看基本面是否是该公司五年期正回报的驱动力。
To quote Buffett, 'Ships will sail around the world but the Flat Earth Society will flourish. There will continue to be wide discrepancies between price and value in the marketplace...' One imperfect but simple way to consider how the market perception of a company has shifted is to compare the change in the earnings per share (EPS) with the share price movement.
引用巴菲特的话说:“船只将在世界各地航行,但Flat Earth Society将蓬勃发展。市场上的价格和价值之间将继续存在巨大差异...”考虑市场对公司的看法发生了怎样的变化的一种不完美但简单的方法是将每股收益(EPS)的变化与股价走势进行比较。
Over half a decade, John B. Sanfilippo & Son managed to grow its earnings per share at 16% a year. The EPS growth is more impressive than the yearly share price gain of 7% over the same period. So it seems the market isn't so enthusiastic about the stock these days.
在过去的五年中,约翰·B.Sanfilippo & Son成功地将其每股收益增长到每年16%。每股收益的增长比同期7%的年度股价增长更令人印象深刻。因此,如今市场似乎对该股并不那么热情。
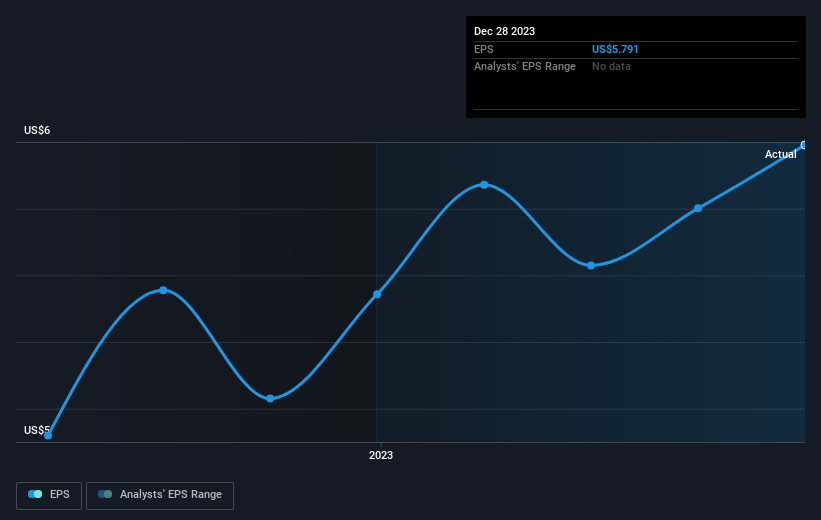
The image below shows how EPS has tracked over time (if you click on the image you can see greater detail).
下图显示了 EPS 在一段时间内的跟踪情况(如果你点击图片,你可以看到更多细节)。
It might be well worthwhile taking a look at our free report on John B. Sanfilippo & Son's earnings, revenue and cash flow.
可能值得一看我们关于John B. Sanfilippo & Son的收益、收入和现金流的免费报告。
What About Dividends?
分红呢?
It is important to consider the total shareholder return, as well as the share price return, for any given stock. Whereas the share price return only reflects the change in the share price, the TSR includes the value of dividends (assuming they were reinvested) and the benefit of any discounted capital raising or spin-off. So for companies that pay a generous dividend, the TSR is often a lot higher than the share price return. We note that for John B. Sanfilippo & Son the TSR over the last 5 years was 79%, which is better than the share price return mentioned above. This is largely a result of its dividend payments!
重要的是要考虑任何给定股票的股东总回报率和股价回报率。尽管股价回报率仅反映股价的变化,但股东总回报率包括股息的价值(假设已进行再投资)以及任何折扣融资或分拆的收益。因此,对于支付丰厚股息的公司来说,股东总回报率通常远高于股价回报率。我们注意到,对于John B. Sanfilippo & Son而言,过去5年的股东总回报率为79%,好于上述股价回报率。这在很大程度上是其股息支付的结果!
A Different Perspective
不同的视角
John B. Sanfilippo & Son provided a TSR of 12% over the last twelve months. Unfortunately this falls short of the market return. The silver lining is that the gain was actually better than the average annual return of 12% per year over five year. This suggests the company might be improving over time. I find it very interesting to look at share price over the long term as a proxy for business performance. But to truly gain insight, we need to consider other information, too. Consider for instance, the ever-present spectre of investment risk. We've identified 1 warning sign with John B. Sanfilippo & Son , and understanding them should be part of your investment process.
在过去的十二个月中,John B. Sanfilippo & Son的股东回报率为12%。不幸的是,这没有达到市场回报率。一线希望是,收益实际上好于五年内每年12%的平均年回报率。这表明随着时间的推移,该公司可能会有所改善。我发现将长期股价视为业务绩效的代表非常有趣。但是,要真正获得见解,我们还需要考虑其他信息。例如,投资风险的幽灵无处不在。我们已经向John B. Sanfilippo & Son确定了一个警告信号,了解这些信号应该是您投资过程的一部分。
Of course John B. Sanfilippo & Son may not be the best stock to buy. So you may wish to see this free collection of growth stocks.
当然,John B. Sanfilippo & Son可能不是最值得买入的股票。因此,您可能希望看到这批免费的成长股。
Please note, the market returns quoted in this article reflect the market weighted average returns of stocks that currently trade on American exchanges.
请注意,本文引用的市场回报反映了目前在美国交易所交易的股票的市场加权平均回报。
Have feedback on this article? Concerned about the content? Get in touch with us directly. Alternatively, email editorial-team (at) simplywallst.com.
This article by Simply Wall St is general in nature. We provide commentary based on historical data and analyst forecasts only using an unbiased methodology and our articles are not intended to be financial advice. It does not constitute a recommendation to buy or sell any stock, and does not take account of your objectives, or your financial situation. We aim to bring you long-term focused analysis driven by fundamental data. Note that our analysis may not factor in the latest price-sensitive company announcements or qualitative material. Simply Wall St has no position in any stocks mentioned.
对这篇文章有反馈吗?对内容感到担忧?直接联系我们。 或者,给编辑团队 (at) simplywallst.com 发送电子邮件。
Simply Wall St的这篇文章本质上是笼统的。我们仅使用公正的方法根据历史数据和分析师的预测提供评论,我们的文章无意作为财务建议。它不构成买入或卖出任何股票的建议,也没有考虑到您的目标或财务状况。我们的目标是为您提供由基本数据驱动的长期重点分析。请注意,我们的分析可能不考虑最新的价格敏感型公司公告或定性材料。简而言之,华尔街没有持有任何上述股票的头寸。
译文内容由第三方软件翻译。