
 Yahoo Finance
 EVZ (ASX:EVZ) May Have Issues Allocating Its Capital
There are a few key trends to look for if we want to identify the next multi-bagger. In a perfect world, we'd like to see a company investing more capital into its business and ideally the returns earned from that capital are also increasing. Put simply, these types of businesses are compounding machines, meaning they are continually reinvesting their earnings at ever-higher rates of return. However, after briefly looking over the numbers, we don't think EVZ (ASX:EVZ) has the makings of a multi-bagger going forward, but let's have a look at why that may be.
Return On Capital Employed (ROCE): What Is It?
For those who don't know, ROCE is a measure of a company's yearly pre-tax profit (its return), relative to the capital employed in the business. Analysts use this formula to calculate it for EVZ:
Return on Capital Employed = Earnings Before Interest and Tax (EBIT) ÷ (Total Assets - Current Liabilities)
0.05 = AU$1.6m ÷ (AU$60m - AU$28m) (Based on the trailing twelve months to June 2023).
Thus, EVZ has an ROCE of 5.0%. In absolute terms, that's a low return and it also under-performs the Construction industry average of 13%.
See our latest analysis for EVZ
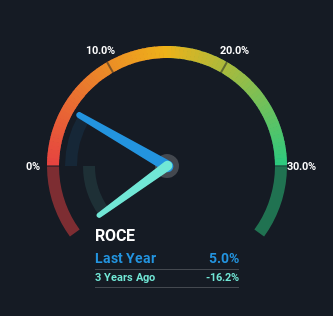
Historical performance is a great place to start when researching a stock so above you can see the gauge for EVZ's ROCE against it's prior returns. If you want to delve into the historical earnings, revenue and cash flow of EVZ, check out these free graphs here.
What Does the ROCE Trend For EVZ Tell Us?
When we looked at the ROCE trend at EVZ, we didn't gain much confidence. Around five years ago the returns on capital were 12%, but since then they've fallen to 5.0%. Although, given both revenue and the amount of assets employed in the business have increased, it could suggest the company is investing in growth, and the extra capital has led to a short-term reduction in ROCE. If these investments prove successful, this can bode very well for long term stock performance.
Another thing to note, EVZ has a high ratio of current liabilities to total assets of 46%. This can bring about some risks because the company is basically operating with a rather large reliance on its suppliers or other sorts of short-term creditors. Ideally we'd like to see this reduce as that would mean fewer obligations bearing risks.
The Key Takeaway
In summary, despite lower returns in the short term, we're encouraged to see that EVZ is reinvesting for growth and has higher sales as a result. However, despite the promising trends, the stock has fallen 27% over the last five years, so there might be an opportunity here for astute investors. As a result, we'd recommend researching this stock further to uncover what other fundamentals of the business can show us.
If you want to know some of the risks facing EVZ we've found 2 warning signs (1 doesn't sit too well with us!) that you should be aware of before investing here.
While EVZ may not currently earn the highest returns, we've compiled a list of companies that currently earn more than 25% return on equity. Check out this free list here.
Have feedback on this article? Concerned about the content? Get in touch with us directly. Alternatively, email editorial-team (at) simplywallst.com.
This article by Simply Wall St is general in nature. We provide commentary based on historical data and analyst forecasts only using an unbiased methodology and our articles are not intended to be financial advice. It does not constitute a recommendation to buy or sell any stock, and does not take account of your objectives, or your financial situation. We aim to bring you long-term focused analysis driven by fundamental data. Note that our analysis may not factor in the latest price-sensitive company announcements or qualitative material. Simply Wall St has no position in any stocks mentioned.
