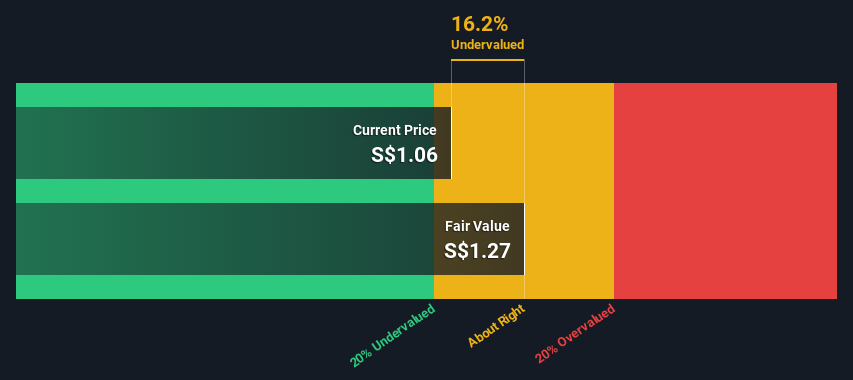
The projected fair value for CapitaLand India Trust is S$1.27 based on Dividend Discount Model
CapitaLand India Trust's S$1.06 share price indicates it is trading at similar levels as its fair value estimate
Our fair value estimate is 2.1% lower than CapitaLand India Trust's analyst price target of S$1.29
In this article we are going to estimate the intrinsic value of CapitaLand India Trust (SGX:CY6U) by taking the expected future cash flows and discounting them to their present value. Our analysis will employ the Discounted Cash Flow (DCF) model. Before you think you won't be able to understand it, just read on! It's actually much less complex than you'd imagine.
Companies can be valued in a lot of ways, so we would point out that a DCF is not perfect for every situation. For those who are keen learners of equity analysis, the Simply Wall St analysis model here may be something of interest to you.
See our latest analysis for CapitaLand India Trust
Is CapitaLand India Trust Fairly Valued?
As CapitaLand India Trust operates in the real estate sector, we need to calculate the intrinsic value slightly differently. Instead of using free cash flows, which are hard to estimate and often not reported by analysts in this industry, dividends per share (DPS) payments are used. This often underestimates the value of a stock, but it can still be good as a comparison to competitors. We use the Gordon Growth Model, which assumes dividend will grow into perpetuity at a rate that can be sustained. The dividend is expected to grow at an annual growth rate equal to the 5-year average of the 10-year government bond yield of 2.0%. We then discount this figure to today's value at a cost of equity of 8.9%. Relative to the current share price of S$1.1, the company appears about fair value at a 16% discount to where the stock price trades currently. Valuations are imprecise instruments though, rather like a telescope - move a few degrees and end up in a different galaxy. Do keep this in mind.
Value Per Share = Expected Dividend Per Share / (Discount Rate - Perpetual Growth Rate)
= S$0.09 / (8.9% – 2.0%)
= S$1.3
SGX:CY6U Discounted Cash Flow January 29th 2024
Important Assumptions
Now the most important inputs to a discounted cash flow are the discount rate, and of course, the actual cash flows. If you don't agree with these result, have a go at the calculation yourself and play with the assumptions. The DCF also does not consider the possible cyclicality of an industry, or a company's future capital requirements, so it does not give a full picture of a company's potential performance. Given that we are looking at CapitaLand India Trust as potential shareholders, the cost of equity is used as the discount rate, rather than the cost of capital (or weighted average cost of capital, WACC) which accounts for debt. In this calculation we've used 8.9%, which is based on a levered beta of 1.370. Beta is a measure of a stock's volatility, compared to the market as a whole. We get our beta from the industry average beta of globally comparable companies, with an imposed limit between 0.8 and 2.0, which is a reasonable range for a stable business.
SWOT Analysis for CapitaLand India Trust
Strength
Debt is well covered by earnings.
Dividends are covered by earnings and cash flows.
Dividend is in the top 25% of dividend payers in the market.
Dividend information for CY6U.
Weakness
Earnings declined over the past year.
Shareholders have been diluted in the past year.
Opportunity
Annual earnings are forecast to grow faster than the Singaporean market.
Good value based on P/E ratio and estimated fair value.
Threat
Debt is not well covered by operating cash flow.
Revenue is forecast to grow slower than 20% per year.
Is CY6U well equipped to handle threats?
Moving On:
Although the valuation of a company is important, it is only one of many factors that you need to assess for a company. The DCF model is not a perfect stock valuation tool. Rather it should be seen as a guide to "what assumptions need to be true for this stock to be under/overvalued?" If a company grows at a different rate, or if its cost of equity or risk free rate changes sharply, the output can look very different. For CapitaLand India Trust, we've put together three fundamental factors you should consider:
Risks: To that end, you should learn about the 5 warning signs we've spotted with CapitaLand India Trust (including 1 which makes us a bit uncomfortable) .
Future Earnings: How does CY6U's growth rate compare to its peers and the wider market? Dig deeper into the analyst consensus number for the upcoming years by interacting with our free analyst growth expectation chart.
Other High Quality Alternatives: Do you like a good all-rounder? Explore our interactive list of high quality stocks to get an idea of what else is out there you may be missing!
PS. The Simply Wall St app conducts a discounted cash flow valuation for every stock on the SGX every day. If you want to find the calculation for other stocks just search here.
Have feedback on this article? Concerned about the content?Get in touch with us directly. Alternatively, email editorial-team (at) simplywallst.com. This article by Simply Wall St is general in nature. We provide commentary based on historical data and analyst forecasts only using an unbiased methodology and our articles are not intended to be financial advice. It does not constitute a recommendation to buy or sell any stock, and does not take account of your objectives, or your financial situation. We aim to bring you long-term focused analysis driven by fundamental data. Note that our analysis may not factor in the latest price-sensitive company announcements or qualitative material. Simply Wall St has no position in any stocks mentioned.
由於CapitaLand India Trust在房地產領域開展業務,因此我們需要以略有不同的方式計算內在價值。沒有使用自由現金流,因爲自由現金流難以估計,而且該行業的分析師通常不報告,而是使用每股股息(DPS)支付。這通常低估了股票的價值,但與競爭對手相比,它仍然可以很好地發揮作用。我們使用戈登增長模型,該模型假設股息將以可以持續的速度永久增長。預計股息將以相當於10年期國債收益率2.0%的5年平均增長率的年增長率增長。然後,我們將這個數字折現爲今天的價值,股本成本爲8.9%。相對於目前1.1新元的股價,該公司的公允價值似乎比目前的股價折扣了16%。但是,估值是不精確的工具,就像望遠鏡一樣——移動幾度,最終進入另一個星系。請記住這一點。
每股價值 = 每股預期股息/(折現率-永久增長率)
= 0.09 新元/(8.9% — 2.0%)
= S$1.3
新加坡證券交易所:CY6U 貼現現金流 2024 年 1 月 29 日
重要假設
現在,貼現現金流的最重要輸入是貼現率,當然還有實際現金流。如果你不同意這些結果,那就自己計算一下,試一試假設。DCF也沒有考慮一個行業可能的週期性,也沒有考慮公司未來的資本需求,因此它沒有全面反映公司的潛在表現。鑑於我們將CapitaLand India Trust視爲潛在股東,因此使用股本成本作爲貼現率,而不是構成債務的資本成本(或加權平均資本成本,WACC)。在此計算中,我們使用了8.9%,這是基於1.370的槓桿測試版。Beta是衡量股票與整個市場相比波動性的指標。我們的測試版來自全球可比公司的行業平均貝塔值,設定在0.8到2.0之間,這是一個穩定的業務的合理範圍。