
 Yahoo Finance
 Brenntag (ETR:BNR) Shareholders Will Want The ROCE Trajectory To Continue
If you're not sure where to start when looking for the next multi-bagger, there are a few key trends you should keep an eye out for. One common approach is to try and find a company with returns on capital employed (ROCE) that are increasing, in conjunction with a growing amount of capital employed. Ultimately, this demonstrates that it's a business that is reinvesting profits at increasing rates of return. So when we looked at Brenntag (ETR:BNR) and its trend of ROCE, we really liked what we saw.
What Is Return On Capital Employed (ROCE)?
For those who don't know, ROCE is a measure of a company's yearly pre-tax profit (its return), relative to the capital employed in the business. To calculate this metric for Brenntag, this is the formula:
Return on Capital Employed = Earnings Before Interest and Tax (EBIT) ÷ (Total Assets - Current Liabilities)
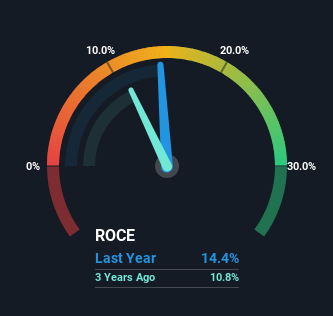
0.14 = €1.1b ÷ (€10b - €2.9b) (Based on the trailing twelve months to September 2023).
Therefore, Brenntag has an ROCE of 14%. In absolute terms, that's a pretty normal return, and it's somewhat close to the Trade Distributors industry average of 16%.
View our latest analysis for Brenntag
Above you can see how the current ROCE for Brenntag compares to its prior returns on capital, but there's only so much you can tell from the past. If you'd like, you can check out the forecasts from the analysts covering Brenntag here for free.
So How Is Brenntag's ROCE Trending?
Brenntag is displaying some positive trends. The numbers show that in the last five years, the returns generated on capital employed have grown considerably to 14%. The amount of capital employed has increased too, by 34%. The increasing returns on a growing amount of capital is common amongst multi-baggers and that's why we're impressed.
In Conclusion...
All in all, it's terrific to see that Brenntag is reaping the rewards from prior investments and is growing its capital base. Since the stock has returned a staggering 116% to shareholders over the last five years, it looks like investors are recognizing these changes. With that being said, we still think the promising fundamentals mean the company deserves some further due diligence.
While Brenntag looks impressive, no company is worth an infinite price. The intrinsic value infographic in our free research report helps visualize whether BNR is currently trading for a fair price.
If you want to search for solid companies with great earnings, check out this free list of companies with good balance sheets and impressive returns on equity.
Have feedback on this article? Concerned about the content? Get in touch with us directly. Alternatively, email editorial-team (at) simplywallst.com.
This article by Simply Wall St is general in nature. We provide commentary based on historical data and analyst forecasts only using an unbiased methodology and our articles are not intended to be financial advice. It does not constitute a recommendation to buy or sell any stock, and does not take account of your objectives, or your financial situation. We aim to bring you long-term focused analysis driven by fundamental data. Note that our analysis may not factor in the latest price-sensitive company announcements or qualitative material. Simply Wall St has no position in any stocks mentioned.
