
ZK International Group Co., Ltd. (NASDAQ:ZKIN) shares have retraced a considerable 28% in the last month, reversing a fair amount of their solid recent performance. Instead of being rewarded, shareholders who have already held through the last twelve months are now sitting on a 29% share price drop.
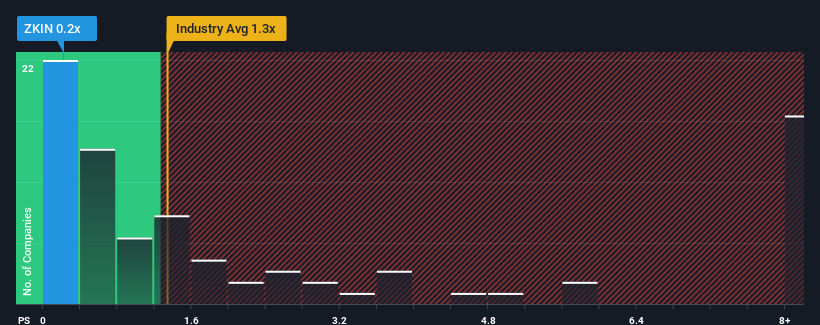
Since its price has dipped substantially, ZK International Group's price-to-sales (or "P/S") ratio of 0.2x might make it look like a buy right now compared to the Metals and Mining industry in the United States, where around half of the companies have P/S ratios above 1.3x and even P/S above 4x are quite common. Nonetheless, we'd need to dig a little deeper to determine if there is a rational basis for the reduced P/S.
Check out our latest analysis for ZK International Group
How ZK International Group Has Been Performing
 The revenue growth achieved at ZK International Group over the last year would be more than acceptable for most companies. One possibility is that the P/S is low because investors think this respectable revenue growth might actually underperform the broader industry in the near future. If that doesn't eventuate, then existing shareholders have reason to be optimistic about the future direction of the share price.
What Are Revenue Growth Metrics Telling Us About The Low P/S?
The only time you'd be truly comfortable seeing a P/S as low as ZK International Group's is when the company's growth is on track to lag the industry.
Taking a look back first, we see that the company managed to grow revenues by a handy 9.0% last year. The latest three year period has also seen an excellent 51% overall rise in revenue, aided somewhat by its short-term performance. So we can start by confirming that the company has done a great job of growing revenues over that time.
When compared to the industry's one-year growth forecast of 9.7%, the most recent medium-term revenue trajectory is noticeably more alluring
In light of this, it's peculiar that ZK International Group's P/S sits below the majority of other companies. Apparently some shareholders believe the recent performance has exceeded its limits and have been accepting significantly lower selling prices.
The Bottom Line On ZK International Group's P/S
ZK International Group's P/S has taken a dip along with its share price. Generally, our preference is to limit the use of the price-to-sales ratio to establishing what the market thinks about the overall health of a company.
Our examination of ZK International Group revealed its three-year revenue trends aren't boosting its P/S anywhere near as much as we would have predicted, given they look better than current industry expectations. When we see strong revenue with faster-than-industry growth, we assume there are some significant underlying risks to the company's ability to make money which is applying downwards pressure on the P/S ratio. While recent revenue trends over the past medium-term suggest that the risk of a price decline is low, investors appear to perceive a likelihood of revenue fluctuations in the future.
You need to take note of risks, for example - ZK International Group has 4 warning signs (and 2 which are a bit concerning) we think you should know about.
Of course, profitable companies with a history of great earnings growth are generally safer bets. So you may wish to see this free collection of other companies that have reasonable P/E ratios and have grown earnings strongly.
Have feedback on this article? Concerned about the content? Get in touch with us directly. Alternatively, email editorial-team (at) simplywallst.com.
This article by Simply Wall St is general in nature. We provide commentary based on historical data and analyst forecasts only using an unbiased methodology and our articles are not intended to be financial advice. It does not constitute a recommendation to buy or sell any stock, and does not take account of your objectives, or your financial situation. We aim to bring you long-term focused analysis driven by fundamental data. Note that our analysis may not factor in the latest price-sensitive company announcements or qualitative material. Simply Wall St has no position in any stocks mentioned.
