
 Yahoo Finance
 Here's What's Concerning About FoundPac Group Berhad's (KLSE:FPGROUP) Returns On Capital
If we want to find a potential multi-bagger, often there are underlying trends that can provide clues. One common approach is to try and find a company with returns on capital employed (ROCE) that are increasing, in conjunction with a growing amount of capital employed. Basically this means that a company has profitable initiatives that it can continue to reinvest in, which is a trait of a compounding machine. Having said that, from a first glance at FoundPac Group Berhad (KLSE:FPGROUP) we aren't jumping out of our chairs at how returns are trending, but let's have a deeper look.
What Is Return On Capital Employed (ROCE)?
For those that aren't sure what ROCE is, it measures the amount of pre-tax profits a company can generate from the capital employed in its business. The formula for this calculation on FoundPac Group Berhad is:
Return on Capital Employed = Earnings Before Interest and Tax (EBIT) ÷ (Total Assets - Current Liabilities)
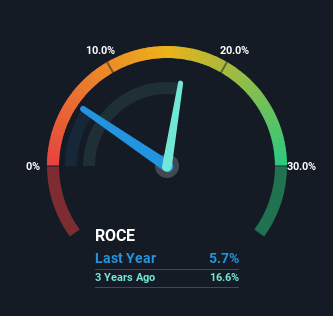
0.057 = RM6.4m ÷ (RM125m - RM12m) (Based on the trailing twelve months to September 2023).
So, FoundPac Group Berhad has an ROCE of 5.7%. Ultimately, that's a low return and it under-performs the Semiconductor industry average of 10%.
Check out our latest analysis for FoundPac Group Berhad
While the past is not representative of the future, it can be helpful to know how a company has performed historically, which is why we have this chart above. If you'd like to look at how FoundPac Group Berhad has performed in the past in other metrics, you can view this free graph of past earnings, revenue and cash flow.
What The Trend Of ROCE Can Tell Us
On the surface, the trend of ROCE at FoundPac Group Berhad doesn't inspire confidence. Over the last five years, returns on capital have decreased to 5.7% from 12% five years ago. And considering revenue has dropped while employing more capital, we'd be cautious. This could mean that the business is losing its competitive advantage or market share, because while more money is being put into ventures, it's actually producing a lower return - "less bang for their buck" per se.
Our Take On FoundPac Group Berhad's ROCE
In summary, we're somewhat concerned by FoundPac Group Berhad's diminishing returns on increasing amounts of capital. Since the stock has skyrocketed 132% over the last five years, it looks like investors have high expectations of the stock. Regardless, we don't feel too comfortable with the fundamentals so we'd be steering clear of this stock for now.
FoundPac Group Berhad does have some risks, we noticed 4 warning signs (and 2 which shouldn't be ignored) we think you should know about.
While FoundPac Group Berhad isn't earning the highest return, check out this free list of companies that are earning high returns on equity with solid balance sheets.
Have feedback on this article? Concerned about the content? Get in touch with us directly. Alternatively, email editorial-team (at) simplywallst.com.
This article by Simply Wall St is general in nature. We provide commentary based on historical data and analyst forecasts only using an unbiased methodology and our articles are not intended to be financial advice. It does not constitute a recommendation to buy or sell any stock, and does not take account of your objectives, or your financial situation. We aim to bring you long-term focused analysis driven by fundamental data. Note that our analysis may not factor in the latest price-sensitive company announcements or qualitative material. Simply Wall St has no position in any stocks mentioned.
