
 Yahoo Finance
 ABM Fujiya Berhad's (KLSE:AFUJIYA) Shares May Have Run Too Fast Too Soon
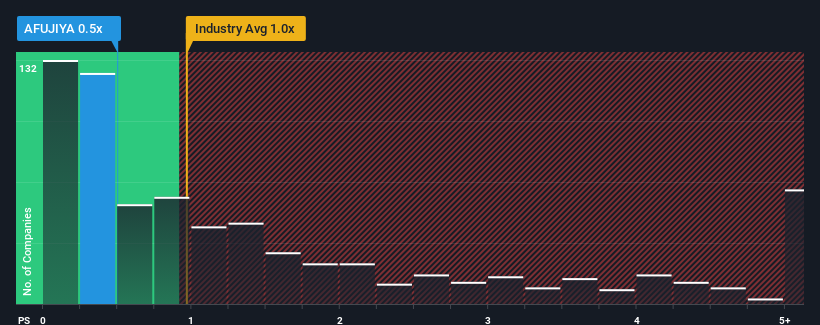
With a median price-to-sales (or "P/S") ratio of close to 0.4x in the Auto Components industry in Malaysia, you could be forgiven for feeling indifferent about ABM Fujiya Berhad's (KLSE:AFUJIYA) P/S ratio of 0.5x. While this might not raise any eyebrows, if the P/S ratio is not justified investors could be missing out on a potential opportunity or ignoring looming disappointment.
View our latest analysis for ABM Fujiya Berhad
What Does ABM Fujiya Berhad's Recent Performance Look Like?
ABM Fujiya Berhad has been doing a good job lately as it's been growing revenue at a solid pace. Perhaps the market is expecting future revenue performance to only keep up with the broader industry, which has keeping the P/S in line with expectations. Those who are bullish on ABM Fujiya Berhad will be hoping that this isn't the case, so that they can pick up the stock at a lower valuation.
Want the full picture on earnings, revenue and cash flow for the company? Then our free report on ABM Fujiya Berhad will help you shine a light on its historical performance.
How Is ABM Fujiya Berhad's Revenue Growth Trending?
There's an inherent assumption that a company should be matching the industry for P/S ratios like ABM Fujiya Berhad's to be considered reasonable.
Retrospectively, the last year delivered an exceptional 15% gain to the company's top line. The latest three year period has also seen a 26% overall rise in revenue, aided extensively by its short-term performance. Therefore, it's fair to say the revenue growth recently has been respectable for the company.
Comparing that to the industry, which is predicted to deliver 15% growth in the next 12 months, the company's momentum is weaker, based on recent medium-term annualised revenue results.
In light of this, it's curious that ABM Fujiya Berhad's P/S sits in line with the majority of other companies. It seems most investors are ignoring the fairly limited recent growth rates and are willing to pay up for exposure to the stock. They may be setting themselves up for future disappointment if the P/S falls to levels more in line with recent growth rates.
The Bottom Line On ABM Fujiya Berhad's P/S
It's argued the price-to-sales ratio is an inferior measure of value within certain industries, but it can be a powerful business sentiment indicator.
Our examination of ABM Fujiya Berhad revealed its poor three-year revenue trends aren't resulting in a lower P/S as per our expectations, given they look worse than current industry outlook. When we see weak revenue with slower than industry growth, we suspect the share price is at risk of declining, bringing the P/S back in line with expectations. Unless the recent medium-term conditions improve, it's hard to accept the current share price as fair value.
You need to take note of risks, for example - ABM Fujiya Berhad has 4 warning signs (and 3 which are significant) we think you should know about.
Of course, profitable companies with a history of great earnings growth are generally safer bets. So you may wish to see this free collection of other companies that have reasonable P/E ratios and have grown earnings strongly.
Have feedback on this article? Concerned about the content? Get in touch with us directly. Alternatively, email editorial-team (at) simplywallst.com.
This article by Simply Wall St is general in nature. We provide commentary based on historical data and analyst forecasts only using an unbiased methodology and our articles are not intended to be financial advice. It does not constitute a recommendation to buy or sell any stock, and does not take account of your objectives, or your financial situation. We aim to bring you long-term focused analysis driven by fundamental data. Note that our analysis may not factor in the latest price-sensitive company announcements or qualitative material. Simply Wall St has no position in any stocks mentioned.
