
 Yahoo Finance
 Investing in Crawford (NYSE:CRD.B) a year ago would have delivered you a 115% gain
When you buy shares in a company, there is always a risk that the price drops to zero. But if you pick the right business to buy shares in, you can make more than you can lose. For example, the Crawford & Company (NYSE:CRD.B) share price had more than doubled in just one year - up 108%. Also pleasing for shareholders was the 19% gain in the last three months. And shareholders have also done well over the long term, with an increase of 36% in the last three years.
With that in mind, it's worth seeing if the company's underlying fundamentals have been the driver of long term performance, or if there are some discrepancies.
See our latest analysis for Crawford
There is no denying that markets are sometimes efficient, but prices do not always reflect underlying business performance. By comparing earnings per share (EPS) and share price changes over time, we can get a feel for how investor attitudes to a company have morphed over time.
During the last year Crawford grew its earnings per share, moving from a loss to a profit.
When a company has just transitioned to profitability, earnings per share growth is not always the best way to look at the share price action.
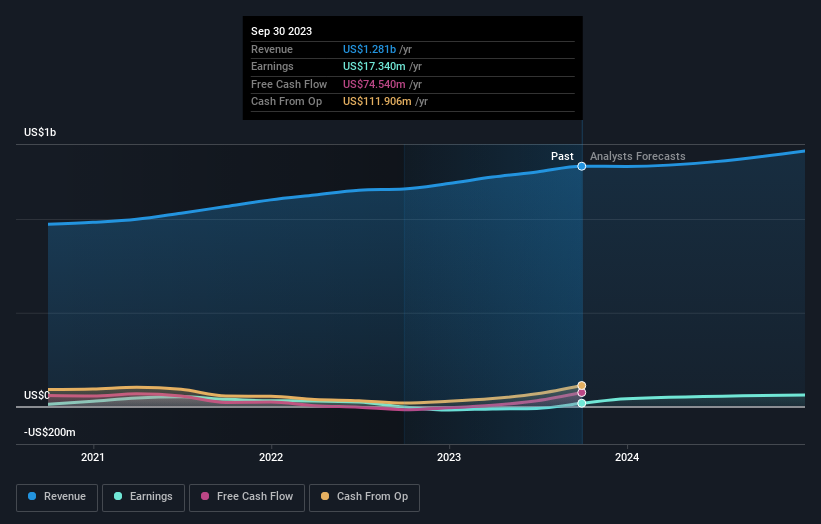
However the year on year revenue growth of 10% would help. Many businesses do go through a phase where they have to forgo some profits to drive business development, and sometimes its for the best.
You can see below how earnings and revenue have changed over time (discover the exact values by clicking on the image).
We know that Crawford has improved its bottom line lately, but what does the future have in store? You can see what analysts are predicting for Crawford in this interactive graph of future profit estimates.
What About Dividends?
When looking at investment returns, it is important to consider the difference between total shareholder return (TSR) and share price return. The TSR incorporates the value of any spin-offs or discounted capital raisings, along with any dividends, based on the assumption that the dividends are reinvested. So for companies that pay a generous dividend, the TSR is often a lot higher than the share price return. As it happens, Crawford's TSR for the last 1 year was 115%, which exceeds the share price return mentioned earlier. The dividends paid by the company have thusly boosted the total shareholder return.
A Different Perspective
We're pleased to report that Crawford shareholders have received a total shareholder return of 115% over one year. That's including the dividend. Since the one-year TSR is better than the five-year TSR (the latter coming in at 8% per year), it would seem that the stock's performance has improved in recent times. Given the share price momentum remains strong, it might be worth taking a closer look at the stock, lest you miss an opportunity. I find it very interesting to look at share price over the long term as a proxy for business performance. But to truly gain insight, we need to consider other information, too. Take risks, for example - Crawford has 2 warning signs we think you should be aware of.
If you would prefer to check out another company -- one with potentially superior financials -- then do not miss this free list of companies that have proven they can grow earnings.
Please note, the market returns quoted in this article reflect the market weighted average returns of stocks that currently trade on American exchanges.
Have feedback on this article? Concerned about the content? Get in touch with us directly. Alternatively, email editorial-team (at) simplywallst.com.
This article by Simply Wall St is general in nature. We provide commentary based on historical data and analyst forecasts only using an unbiased methodology and our articles are not intended to be financial advice. It does not constitute a recommendation to buy or sell any stock, and does not take account of your objectives, or your financial situation. We aim to bring you long-term focused analysis driven by fundamental data. Note that our analysis may not factor in the latest price-sensitive company announcements or qualitative material. Simply Wall St has no position in any stocks mentioned.
