
Economic Crossroads: Stock Market Reacts To U.S. Jobs Report, Fueling Speculation On Future Rate Cuts
Economic Crossroads: Stock Market Reacts To U.S. Jobs Report, Fueling Speculation On Future Rate Cuts
 Must Read: With The GRAMMYs Just Two Months Out, The Music Industry Is Still Going Strong - What Will It Look Like In 2030?
 The SPDR S&P 500 (NYSE:SPY) popped up about 0.5% higher at one point Friday, despite U.S. Bureau of Labor Statistics data showing non-farm payrolls came in higher-than-expected, which brought into question whether the Federal Reserve will follow through with a rate cut campaign next year.
儘管美國勞工統計局的數據顯示非農就業人數高於預期,這使人們質疑美聯儲明年是否會繼續降息運動,但SPDR標準普爾500指數(紐約證券交易所代碼:SPY)週五一度上漲約0.5%。
While the news caused the SPY to open slightly lower, bulls came in and bought the dip, causing the market ETF to break above Thursday's high-of-day.
儘管該消息導致SPY開盤小幅走低,但多頭卻逢低買入,導致市場ETF突破週四的高點。
Whether or not the market will continue higher imminently or continue to trade sideways remains to be seen, but the SPY's uptrend is intact and the ETF is holding above the eight-day exponential moving average (EMA) on the daily chart.
市場是即將繼續走高還是繼續橫盤交易還有待觀察,但SPY的上漲趨勢完好無損,ETF在日線圖上保持在八天指數移動平均線(EMA)上方。
Must Read: With The GRAMMYs Just Two Months Out, The Music Industry Is Still Going Strong - What Will It Look Like In 2030?
必讀:格萊美頒獎典禮僅兩個月後,音樂行業仍在蓬勃發展——2030年會是什麼樣子?
Trending: Chances Are You're Wrong On Bidenomics: Survey Finds Wildly Concerning Views About Wealth, Income And Jobs
趨勢:你在Bidenomics上可能錯了:調查發現關於財富、收入和就業的看法非常令人擔憂
More experienced traders who wish to play the SPY either bullishly or bearishly may choose to do so through one of two Direxion ETFs. Bullish traders can enter a short-term position in Direxion Daily S&P 500 Bull 3X Shares (NYSE:SPXL) and bearish traders can trade the inverse ETF, Direxion Daily S&P 500 Bear 3X Shares (NYSE:SPXS).
希望以看漲或看跌的方式玩SPY的經驗更豐富的交易者可以選擇通過兩種Direxion ETF中的一種來玩SPY。看漲的交易者可以在Direxion Daily標準普爾500指數牛市3X股(紐約證券交易所代碼:SPXL)中進入短期頭寸,看跌的交易者可以交易反向ETF,即Direxion Daily標準普爾500熊3X股(紐約證券交易所代碼:SPXS)。
The ETFs: SPXL and SPXS are triple leveraged funds that track the movement of the SPY, seeking a return of 300% or –300% on the return of the benchmark index over a single day.
ETF:SPXL和SPXS是追蹤SPY走勢的三倍槓桿基金,尋求基準指數在一天內獲得300%或-300%的回報。
It should be noted that leveraged ETFs are meant to be used as a trading vehicle as opposed to long-term investments.
應該注意的是,槓桿ETF旨在用作交易工具,而不是長期投資。
Want direct analysis? Find me in the BZ Pro lounge! Click here for a free trial.
想要直接分析?在 BZ Pro 休息室找我!點擊此處免費試用。
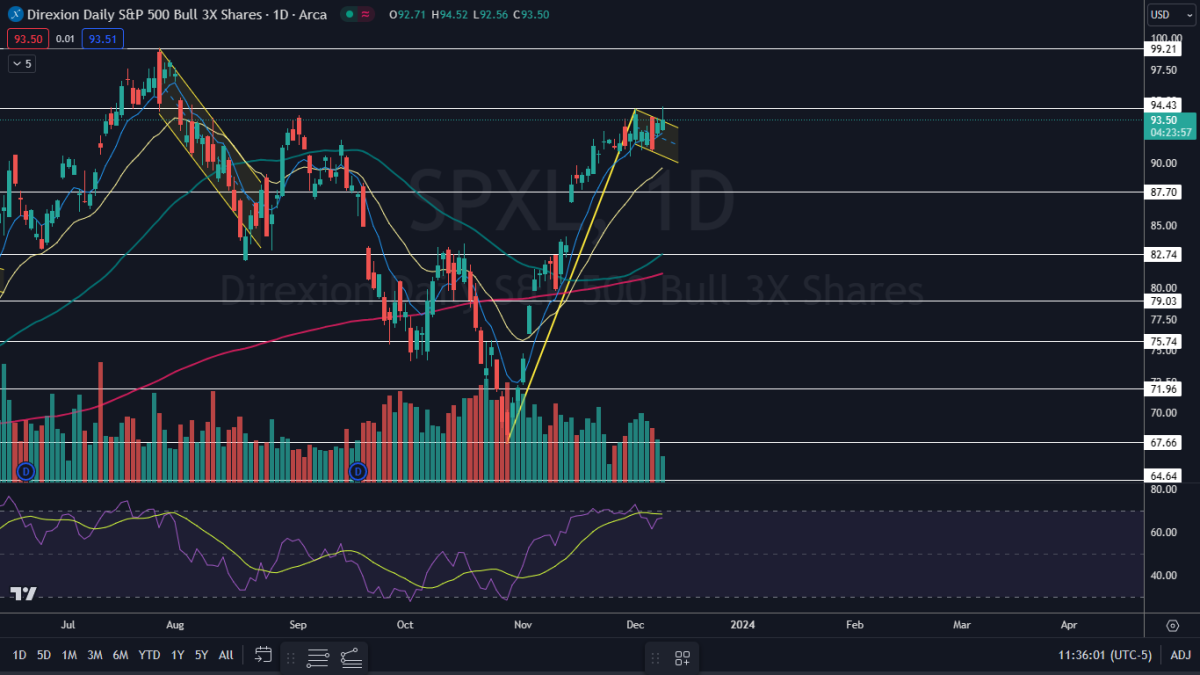
The SPXL Chart: Between Oct. 27 and Friday, SPXL has formed a massive bull flag pattern on the daily chart, with a measured move of a whopping 39.5%. If the pattern is recognized and the SPY breaks up from its own bull flag on higher-than-average volume, SPXL could be headed toward the $126 mark.
SPXL走勢圖:在10月27日至週五之間,SPXL在日線圖上形成了巨大的牛旗形態,測得的漲幅高達39.5%。如果該模式得到識別,並且SPY因交易量高於平均水平而突破自己的牛市,則SPXL可能會走向126美元大關。
- On Friday, SPXL confirmed its uptrend remains intact. The most recent higher low was formed on Wednesday at $90.96 and the most recent confirmed higher high was printed at the $94.31 mark on Dec. 1. If the ETF retraces on Monday and continues to trade within the flag for a longer period, Friday's high-of-day will serve as the next higher high within the uptrend.
- Continued consolidation within the flag would help to drop SPXL's relative strength index (RSI) further down below the 70% level, which the bulls would like to see. When a stock's or ETF's RSI nears or exceeds the 70% mark it becomes overbought, which can be a sell signal for technical traders.
- Bearish traders want to see the ETF drop under the eight-day EMA, which could suggest the uptrend will be negated for a period of time, which could accelerate downside pressure.
- SPXL has resistance above at $94.43 and at $99.21 and support below at $87.70 and at $82.74.
- 週五,SPXL證實其上漲趨勢保持不變。最近的較高低點於週三形成,爲90.96美元,最近確認的更高高點於12月1日創下94.31美元。如果ETF在週一回撤併在更長的時間內繼續在旗幟內交易,則週五的高點將成爲上升趨勢中的下一個更高的高點。
- 旗幟內的持續盤整將有助於將SPXL的相對強弱指數(RSI)進一步降至多頭希望看到的70%以下。當股票或ETF的RSI接近或超過70%大關時,它就會變得超買,這可能是技術交易者的賣出信號。
- 看跌的交易者希望看到ETF跌破八日均線,這可能表明上漲趨勢將在一段時間內被抵消,這可能會加劇下行壓力。
- SPXL的阻力位高於94.43美元和99.21美元,支撐位低於87.70美元和82.74美元。
譯文內容由第三人軟體翻譯。
