
The Returns On Capital At Straco (SGX:S85) Don't Inspire Confidence
The Returns On Capital At Straco (SGX:S85) Don't Inspire Confidence
When we're researching a company, it's sometimes hard to find the warning signs, but there are some financial metrics that can help spot trouble early. When we see a declining return on capital employed (ROCE) in conjunction with a declining base of capital employed, that's often how a mature business shows signs of aging. This indicates to us that the business is not only shrinking the size of its net assets, but its returns are falling as well. So after we looked into Straco (SGX:S85), the trends above didn't look too great.
當我們研究一家公司時,有時很難找到警告信號,但是有一些財務指標可以幫助及早發現問題。當我們看到下降時 返回 在資本使用率(ROCE)的下降的同時 基礎 在使用的資本中,成熟的企業通常就是這樣顯示出老齡化跡象的。這向我們表明,該企業不僅縮小了淨資產規模,而且回報率也在下降。因此,在我們研究了Straco(SGX: S85)之後,上述趨勢看起來並不太好。
What Is Return On Capital Employed (ROCE)?
什麼是資本使用回報率(ROCE)?
For those who don't know, ROCE is a measure of a company's yearly pre-tax profit (its return), relative to the capital employed in the business. The formula for this calculation on Straco is:
對於那些不知道的人來說,投資回報率是衡量公司年度稅前利潤(其回報率)與企業所用資本的關係。在 Straco 上進行此計算的公式爲:
Return on Capital Employed = Earnings Before Interest and Tax (EBIT) ÷ (Total Assets - Current Liabilities)
已動用資本回報率 = 息稅前收益 (EBIT) ¥(總資產-流動負債)
0.03 = S$9.6m ÷ (S$336m - S$13m) (Based on the trailing twelve months to June 2023).
0.03 = 960 萬新元 ¥(3.36億新元至1300萬新元) (基於截至 2023 年 6 月的過去十二個月)。
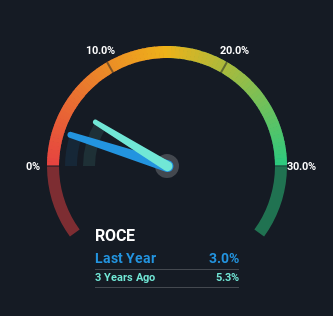
Thus, Straco has an ROCE of 3.0%. In absolute terms, that's a low return and it also under-performs the Hospitality industry average of 3.9%.
因此,Straco的投資回報率爲3.0%。從絕對值來看,這是一個低迴報,而且表現也低於酒店業3.9%的平均水平。
See our latest analysis for Straco
查看我們對Straco的最新分析
While the past is not representative of the future, it can be helpful to know how a company has performed historically, which is why we have this chart above. If you'd like to look at how Straco has performed in the past in other metrics, you can view this free graph of past earnings, revenue and cash flow.
雖然過去不能代表未來,但了解一家公司的歷史表現可能會有所幫助,這就是我們上面有這張圖表的原因。如果您想查看Straco過去在其他指標中的表現,可以查看這張免費的過去收益、收入和現金流圖表。
How Are Returns Trending?
退貨趨勢如何?
There is reason to be cautious about Straco, given the returns are trending downwards. About five years ago, returns on capital were 18%, however they're now substantially lower than that as we saw above. And on the capital employed front, the business is utilizing roughly the same amount of capital as it was back then. Since returns are falling and the business has the same amount of assets employed, this can suggest it's a mature business that hasn't had much growth in the last five years. So because these trends aren't typically conducive to creating a multi-bagger, we wouldn't hold our breath on Straco becoming one if things continue as they have.
鑑於回報率呈下降趨勢,有理由對Straco持謹慎態度。大約五年前,資本回報率爲18%,但現在已大大低於我們在上面看到的水平。在資本使用方面,該企業使用的資本量與當時大致相同。由於回報率下降且該企業使用的資產數量相同,這可能表明它是一家成熟的企業,在過去五年中增長幅度不大。因此,由於這些趨勢通常不利於創造多功能裝備,因此,如果事情照原樣繼續下去,我們就不會屏住呼吸了 Straco 成爲其中之一。
Our Take On Straco's ROCE
我們對 Straco ROCE 的看法
All in all, the lower returns from the same amount of capital employed aren't exactly signs of a compounding machine. It should come as no surprise then that the stock has fallen 20% over the last five years, so it looks like investors are recognizing these changes. Unless there is a shift to a more positive trajectory in these metrics, we would look elsewhere.
總而言之,使用相同數額的資本所產生的較低迴報並不完全是複合機器的跡象。因此,該股在過去五年中下跌了20%也就不足爲奇了,因此看來投資者已經意識到了這些變化。除非這些指標轉向更積極的軌跡,否則我們會將目光投向其他地方。
If you'd like to know more about Straco, we've spotted 2 warning signs, and 1 of them is significant.
如果你想進一步了解 Straco,我們發現了 2 個警告標誌,其中 1 個很重要。
For those who like to invest in solid companies, check out this free list of companies with solid balance sheets and high returns on equity.
對於那些喜歡投資穩健公司的人,可以查看這份資產負債表穩健和股本回報率高的公司的免費清單。
Have feedback on this article? Concerned about the content? Get in touch with us directly. Alternatively, email editorial-team (at) simplywallst.com.
This article by Simply Wall St is general in nature. We provide commentary based on historical data and analyst forecasts only using an unbiased methodology and our articles are not intended to be financial advice. It does not constitute a recommendation to buy or sell any stock, and does not take account of your objectives, or your financial situation. We aim to bring you long-term focused analysis driven by fundamental data. Note that our analysis may not factor in the latest price-sensitive company announcements or qualitative material. Simply Wall St has no position in any stocks mentioned.
對這篇文章有反饋嗎?對內容感到擔憂?直接聯繫我們。 或者,給編輯團隊 (at) simplywallst.com 發送電子郵件。
Simply Wall St的這篇文章本質上是籠統的。我們僅使用公正的方法根據歷史數據和分析師的預測提供評論,我們的文章無意作爲財務建議。它不構成買入或賣出任何股票的建議,也沒有考慮到您的目標或財務狀況。我們的目標是爲您提供由基本數據驅動的長期重點分析。請注意,我們的分析可能不考慮最新的價格敏感型公司公告或定性材料。簡而言之,華爾街沒有持有任何上述股票的頭寸。
譯文內容由第三人軟體翻譯。