
 Yahoo Finance
 Returns On Capital Are Showing Encouraging Signs At NL Industries (NYSE:NL)
What are the early trends we should look for to identify a stock that could multiply in value over the long term? Ideally, a business will show two trends; firstly a growing return on capital employed (ROCE) and secondly, an increasing amount of capital employed. Basically this means that a company has profitable initiatives that it can continue to reinvest in, which is a trait of a compounding machine. So when we looked at NL Industries (NYSE:NL) and its trend of ROCE, we really liked what we saw.
Return On Capital Employed (ROCE): What Is It?
For those that aren't sure what ROCE is, it measures the amount of pre-tax profits a company can generate from the capital employed in its business. The formula for this calculation on NL Industries is:
Return on Capital Employed = Earnings Before Interest and Tax (EBIT) ÷ (Total Assets - Current Liabilities)
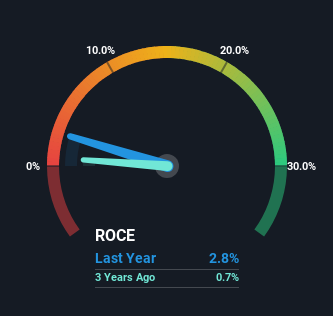
0.028 = US$15m ÷ (US$570m - US$30m) (Based on the trailing twelve months to September 2023).
Thus, NL Industries has an ROCE of 2.8%. In absolute terms, that's a low return and it also under-performs the Commercial Services industry average of 8.9%.
View our latest analysis for NL Industries
While the past is not representative of the future, it can be helpful to know how a company has performed historically, which is why we have this chart above. If you'd like to look at how NL Industries has performed in the past in other metrics, you can view this free graph of past earnings, revenue and cash flow.
What Can We Tell From NL Industries' ROCE Trend?
While the ROCE isn't as high as some other companies out there, it's great to see it's on the up. The figures show that over the last five years, ROCE has grown 108% whilst employing roughly the same amount of capital. So our take on this is that the business has increased efficiencies to generate these higher returns, all the while not needing to make any additional investments. On that front, things are looking good so it's worth exploring what management has said about growth plans going forward.
On a related note, the company's ratio of current liabilities to total assets has decreased to 5.3%, which basically reduces it's funding from the likes of short-term creditors or suppliers. So shareholders would be pleased that the growth in returns has mostly come from underlying business performance.
The Bottom Line On NL Industries' ROCE
To bring it all together, NL Industries has done well to increase the returns it's generating from its capital employed. And investors seem to expect more of this going forward, since the stock has rewarded shareholders with a 49% return over the last five years. Therefore, we think it would be worth your time to check if these trends are going to continue.
One more thing to note, we've identified 1 warning sign with NL Industries and understanding it should be part of your investment process.
While NL Industries may not currently earn the highest returns, we've compiled a list of companies that currently earn more than 25% return on equity. Check out this free list here.
Have feedback on this article? Concerned about the content? Get in touch with us directly. Alternatively, email editorial-team (at) simplywallst.com.
This article by Simply Wall St is general in nature. We provide commentary based on historical data and analyst forecasts only using an unbiased methodology and our articles are not intended to be financial advice. It does not constitute a recommendation to buy or sell any stock, and does not take account of your objectives, or your financial situation. We aim to bring you long-term focused analysis driven by fundamental data. Note that our analysis may not factor in the latest price-sensitive company announcements or qualitative material. Simply Wall St has no position in any stocks mentioned.