
 Yahoo Finance
 Potential Upside For Axteria Group Berhad (KLSE:AXTERIA) Not Without Risk
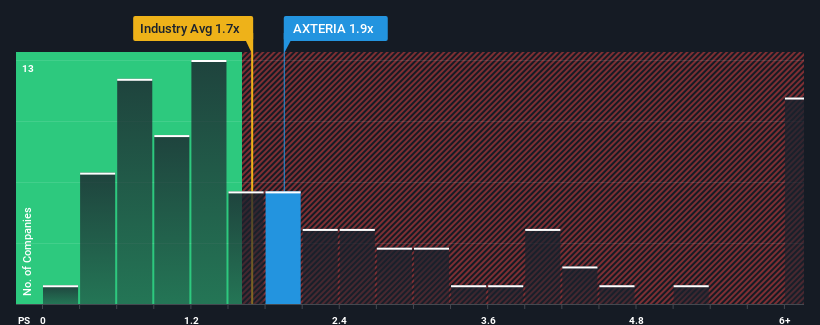
There wouldn't be many who think Axteria Group Berhad's (KLSE:AXTERIA) price-to-sales (or "P/S") ratio of 1.9x is worth a mention when the median P/S for the Real Estate industry in Malaysia is similar at about 1.7x. While this might not raise any eyebrows, if the P/S ratio is not justified investors could be missing out on a potential opportunity or ignoring looming disappointment.
View our latest analysis for Axteria Group Berhad
What Does Axteria Group Berhad's Recent Performance Look Like?
Axteria Group Berhad certainly has been doing a great job lately as it's been growing its revenue at a really rapid pace. Perhaps the market is expecting future revenue performance to taper off, which has kept the P/S from rising. If you like the company, you'd be hoping this isn't the case so that you could potentially pick up some stock while it's not quite in favour.
Although there are no analyst estimates available for Axteria Group Berhad, take a look at this free data-rich visualisation to see how the company stacks up on earnings, revenue and cash flow.
What Are Revenue Growth Metrics Telling Us About The P/S?
In order to justify its P/S ratio, Axteria Group Berhad would need to produce growth that's similar to the industry.
Taking a look back first, we see that the company grew revenue by an impressive 186% last year. This great performance means it was also able to deliver immense revenue growth over the last three years. So we can start by confirming that the company has done a tremendous job of growing revenue over that time.
This is in contrast to the rest of the industry, which is expected to grow by 9.6% over the next year, materially lower than the company's recent medium-term annualised growth rates.
With this information, we find it interesting that Axteria Group Berhad is trading at a fairly similar P/S compared to the industry. It may be that most investors are not convinced the company can maintain its recent growth rates.
The Bottom Line On Axteria Group Berhad's P/S
While the price-to-sales ratio shouldn't be the defining factor in whether you buy a stock or not, it's quite a capable barometer of revenue expectations.
To our surprise, Axteria Group Berhad revealed its three-year revenue trends aren't contributing to its P/S as much as we would have predicted, given they look better than current industry expectations. When we see strong revenue with faster-than-industry growth, we can only assume potential risks are what might be placing pressure on the P/S ratio. It appears some are indeed anticipating revenue instability, because the persistence of these recent medium-term conditions would normally provide a boost to the share price.
And what about other risks? Every company has them, and we've spotted 4 warning signs for Axteria Group Berhad (of which 2 are concerning!) you should know about.
It's important to make sure you look for a great company, not just the first idea you come across. So if growing profitability aligns with your idea of a great company, take a peek at this free list of interesting companies with strong recent earnings growth (and a low P/E).
Have feedback on this article? Concerned about the content? Get in touch with us directly. Alternatively, email editorial-team (at) simplywallst.com.
This article by Simply Wall St is general in nature. We provide commentary based on historical data and analyst forecasts only using an unbiased methodology and our articles are not intended to be financial advice. It does not constitute a recommendation to buy or sell any stock, and does not take account of your objectives, or your financial situation. We aim to bring you long-term focused analysis driven by fundamental data. Note that our analysis may not factor in the latest price-sensitive company announcements or qualitative material. Simply Wall St has no position in any stocks mentioned.
