
KPC Pharmaceuticals,Inc's (SHSE:600422) Stock Is Soaring But Financials Seem Inconsistent: Will The Uptrend Continue?
KPC Pharmaceuticals,Inc's (SHSE:600422) Stock Is Soaring But Financials Seem Inconsistent: Will The Uptrend Continue?
KPC PharmaceuticalsInc's (SHSE:600422) stock is up by a considerable 22% over the past three months. But the company's key financial indicators appear to be differing across the board and that makes us question whether or not the company's current share price momentum can be maintained. Particularly, we will be paying attention to KPC PharmaceuticalsInc's ROE today.
在過去三個月中,KPC PharmicalsInc(上海證券交易所代碼:600422)的股票大幅上漲了22%。但是該公司的關鍵財務指標似乎各不相同,這使我們質疑該公司目前的股價勢頭能否保持下去。特別是,我們今天將關注KPC PharmicalsInc的投資回報率。
ROE or return on equity is a useful tool to assess how effectively a company can generate returns on the investment it received from its shareholders. In other words, it is a profitability ratio which measures the rate of return on the capital provided by the company's shareholders.
投資回報率或股本回報率是評估公司如何有效地從股東那裏獲得投資回報的有用工具。換句話說,它是衡量公司股東提供的資本回報率的盈利比率。
Check out our latest analysis for KPC PharmaceuticalsInc
查看我們對KPC PharmicalsInc的最新分析
How To Calculate Return On Equity?
如何計算股本回報率?
Return on equity can be calculated by using the formula:
股本回報率可以使用以下公式計算:
Return on Equity = Net Profit (from continuing operations) ÷ Shareholders' Equity
股本回報率 = 淨利潤(來自持續經營業務)÷ 股東權益
So, based on the above formula, the ROE for KPC PharmaceuticalsInc is:
因此,根據上述公式,KPC PharmicalsInc的投資回報率爲:
7.4% = CN¥401m ÷ CN¥5.4b (Based on the trailing twelve months to September 2023).
7.4% = 4.01億元人民幣 ¥54億元人民幣(基於截至2023年9月的過去十二個月)。
The 'return' is the yearly profit. That means that for every CN¥1 worth of shareholders' equity, the company generated CN¥0.07 in profit.
“回報” 是每年的利潤。這意味着,公司每獲得價值1元人民幣的股東權益,就會產生0.07元的利潤。
Why Is ROE Important For Earnings Growth?
爲什麼投資回報率對收益增長很重要?
We have already established that ROE serves as an efficient profit-generating gauge for a company's future earnings. We now need to evaluate how much profit the company reinvests or "retains" for future growth which then gives us an idea about the growth potential of the company. Assuming all else is equal, companies that have both a higher return on equity and higher profit retention are usually the ones that have a higher growth rate when compared to companies that don't have the same features.
我們已經確定,投資回報率是衡量公司未來收益的有效盈利指標。現在,我們需要評估公司再投資或 “保留” 了多少利潤以用於未來的增長,從而使我們對公司的增長潛力有所了解。假設其他條件都一樣,與功能不相同的公司相比,具有更高股本回報率和更高利潤保留率的公司通常具有更高的增長率。
KPC PharmaceuticalsInc's Earnings Growth And 7.4% ROE
KPC PharmicalsInc的收益增長和7.4%的投資回報率
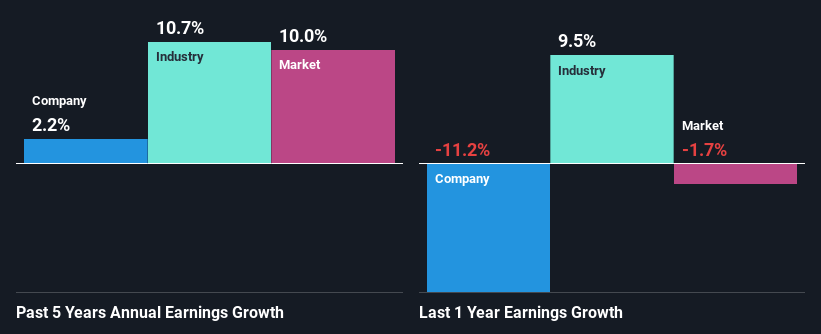
On the face of it, KPC PharmaceuticalsInc's ROE is not much to talk about. However, its ROE is similar to the industry average of 8.4%, so we won't completely dismiss the company. Having said that, KPC PharmaceuticalsInc has shown a meagre net income growth of 2.2% over the past five years. Remember, the company's ROE is not particularly great to begin with. Hence, this does provide some context to low earnings growth seen by the company.
從表面上看,KPC PharmicalsInc的投資回報率沒什麼好說的。但是,其投資回報率與8.4%的行業平均水平相似,因此我們不會完全解僱該公司。話雖如此,在過去五年中,KPC PharmicalsInc的淨收入增長微乎其微,爲2.2%。請記住,該公司的投資回報率一開始並不是特別好。因此,這確實爲該公司看到的低收益增長提供了一些背景信息。
We then compared KPC PharmaceuticalsInc's net income growth with the industry and found that the company's growth figure is lower than the average industry growth rate of 11% in the same 5-year period, which is a bit concerning.
然後,我們將KPC PharmicalsInc的淨收入增長與該行業進行了比較,發現該公司的增長數字低於同期11%的行業平均增長率,這有點令人擔憂。
The basis for attaching value to a company is, to a great extent, tied to its earnings growth. What investors need to determine next is if the expected earnings growth, or the lack of it, is already built into the share price. Doing so will help them establish if the stock's future looks promising or ominous. If you're wondering about KPC PharmaceuticalsInc's's valuation, check out this gauge of its price-to-earnings ratio, as compared to its industry.
賦予公司價值的基礎在很大程度上與其收益增長息息相關。投資者接下來需要確定的是,預期的收益增長或缺乏收益增長是否已經包含在股價中。這樣做將幫助他們確定股票的未來是光明還是不祥。如果你想知道KPC Pharmicalsinc的估值,可以看看這個衡量其市盈率與行業比較的指標。
Is KPC PharmaceuticalsInc Using Its Retained Earnings Effectively?
KPC PharmicalsInc 是否在有效使用其留存收益?
Despite having a normal three-year median payout ratio of 32% (or a retention ratio of 68% over the past three years, KPC PharmaceuticalsInc has seen very little growth in earnings as we saw above. So there could be some other explanation in that regard. For instance, the company's business may be deteriorating.
儘管在過去三年中,KPC PharmicalsInc的三年中位支付率正常爲32%(或留存率爲68%),但如上所述,其收益增長微乎其微。因此,在這方面可能還有其他解釋。例如,該公司的業務可能正在惡化。
Additionally, KPC PharmaceuticalsInc has paid dividends over a period of at least ten years, which means that the company's management is determined to pay dividends even if it means little to no earnings growth.
此外,KPC PharmacesticalSinc已在至少十年的時間內支付了股息,這意味着即使這意味着幾乎沒有收益增長,該公司的管理層也決心支付股息。
Conclusion
結論
On the whole, we feel that the performance shown by KPC PharmaceuticalsInc can be open to many interpretations. Even though it appears to be retaining most of its profits, given the low ROE, investors may not be benefitting from all that reinvestment after all. The low earnings growth suggests our theory correct. With that said, the latest industry analyst forecasts reveal that the company's earnings are expected to accelerate. Are these analysts expectations based on the broad expectations for the industry, or on the company's fundamentals? Click here to be taken to our analyst's forecasts page for the company.
總的來說,我們認爲KPC PharmicalsInc表現出的表現可以有多種解釋。儘管它似乎保留了大部分利潤,但鑑於投資回報率低,投資者畢竟可能無法從所有這些再投資中受益。低收益增長表明我們的理論是正確的。話雖如此,最新的行業分析師預測顯示,該公司的收益預計將加速。這些分析師的預期是基於對該行業的廣泛預期,還是基於公司的基本面?點擊此處進入我們分析師對公司的預測頁面。
Have feedback on this article? Concerned about the content? Get in touch with us directly. Alternatively, email editorial-team (at) simplywallst.com.
This article by Simply Wall St is general in nature. We provide commentary based on historical data and analyst forecasts only using an unbiased methodology and our articles are not intended to be financial advice. It does not constitute a recommendation to buy or sell any stock, and does not take account of your objectives, or your financial situation. We aim to bring you long-term focused analysis driven by fundamental data. Note that our analysis may not factor in the latest price-sensitive company announcements or qualitative material. Simply Wall St has no position in any stocks mentioned.
對這篇文章有反饋嗎?對內容感到擔憂?直接聯繫我們。 或者,給編輯團隊 (at) simplywallst.com 發送電子郵件。
Simply Wall St的這篇文章本質上是籠統的。我們僅使用公正的方法根據歷史數據和分析師的預測提供評論,我們的文章無意作爲財務建議。它不構成買入或賣出任何股票的建議,也沒有考慮到您的目標或財務狀況。我們的目標是爲您提供由基本數據驅動的長期重點分析。請注意,我們的分析可能不考慮最新的價格敏感型公司公告或定性材料。簡而言之,華爾街沒有持有任何上述股票的頭寸。
譯文內容由第三人軟體翻譯。