
Cathie Wood-Led ARKK Struggles To Hold Steady Amid Tesla's Slide: When A Bounce Takes Place, This ETF Offers Leverage
Cathie Wood-Led ARKK Struggles To Hold Steady Amid Tesla's Slide: When A Bounce Takes Place, This ETF Offers Leverage
 Tesla holds the highest weighting within ARKK and has continued to fall lower since reporting a third-quarter earnings miss on Oct. 18.
The AXS 2x Innovation ETF (NASDAQ:TARK) was slightly volatile on Monday, in tandem with the Cathie Wood-led ARK Innovation ETF (NYSE:ARKK), which TARK tracks.
這個 AXS 2x 創新 ETF 納斯達克股票代碼:TARK)週一略有波動,與此同時 凱茜伍德-主導的方舟創新ETF(紐約證券交易所代碼:ARKK),TARK對其進行追蹤。
TARK is an actively managed double-leveraged ETF aiming to return 200% of the daily performance of ARKK.
TARK是一個積極管理的雙槓杆ETF,旨在回報ARKK每日表現的200%。
Why ARKK Has Been Seeing Downside Pressure: Despite Coinbase Global, Inc, which is the second largest holding in the ARKK fund, seeing some slightly bullish price action ahead of its third-quarter earnings on Thursday, the ETF was stalling due to Tesla's price action.
爲什麼 ARKK 一直面臨下行壓力: 儘管 Coinbase Global,這是ARKK基金的第二大持股,在週四公佈第三季度業績之前,該ETF的價格走勢略有看漲,原因是該ETF停滯不前 特斯拉的 價格走勢。
Tesla holds the highest weighting within ARKK and has continued to fall lower since reporting a third-quarter earnings miss on Oct. 18.
特斯拉在ARKK中的權重最高,自10月18日公佈第三季度業績虧損以來,特斯拉的權重持續走低。
A larger bounce may be imminent for ARKK, however, because the ETF was bouncing up from the bottom of a falling channel pattern and when the fund rebounds, TARK will offer 2X the gains of ARKK.
但是,ARKK可能即將出現更大的反彈,因爲ETF是從下跌通道模式的底部反彈,當基金反彈時,TARK的收益將是ARKK的2倍。
A falling channel pattern is bearish for the short term but can be bullish down the road.
下跌通道模式短期內看跌,但未來可能會看漲。
For bearish traders, the "trend is your friend" (until it's not) and the stock is likely to continue downwards. Aggressive traders may decide to short the stock at the upper trendline and exit the trade at the lower trendline.
對於看跌的交易者來說,“趨勢是你的朋友”(直到不是),該股可能會繼續下跌。激進的交易者可能會決定在上方趨勢線做空股票,在較低的趨勢線退出交易。
Bullish traders will want to watch for a break up from the upper descending trendline, on high volume, for an entry. When a stock breaks up from a descending channel, it's a powerful reversal signal and indicates a rally is likely in the cards.
看漲的交易者將希望觀察從上方的下降趨勢線突破以獲得高成交量。當一隻股票從下降通道突破時,這是一個強大的反轉信號,表明可能會出現反彈。
Want direct analysis? Find me in the BZ Pro lounge! Click here for a free trial.
想要直接分析?在 BZ Pro 休息室找我!點擊此處免費試用。
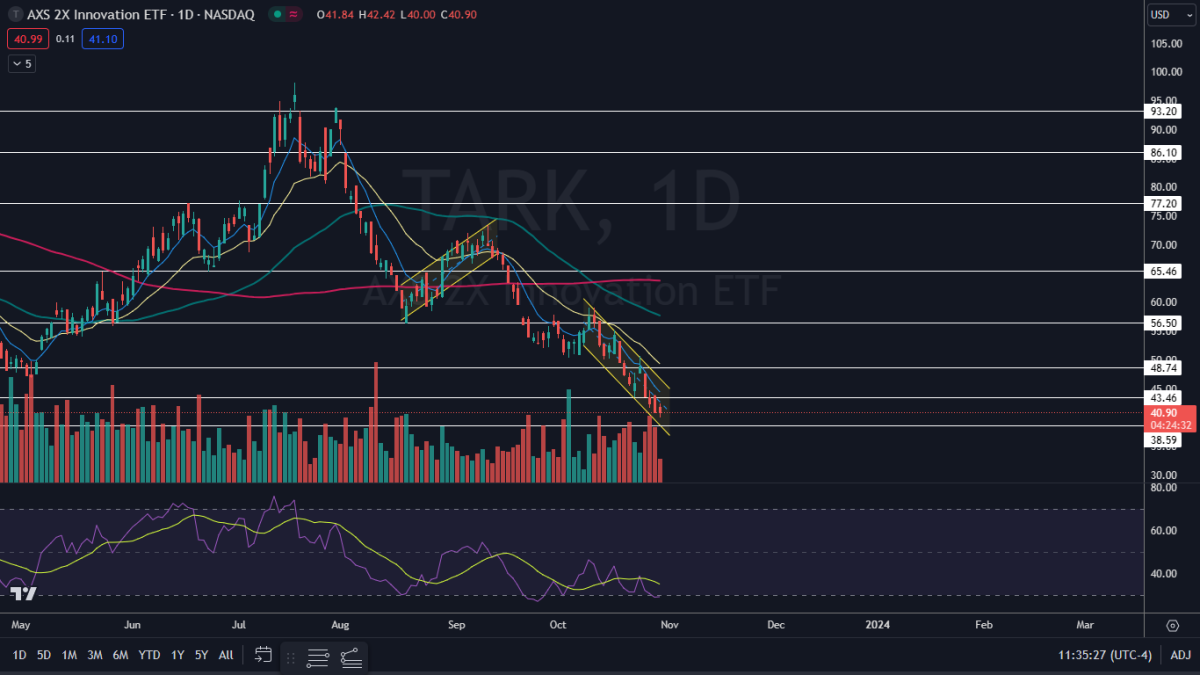
The TARK Chart: Tark started to trade in a falling channel pattern on Oct. 10 and within the formation, the ETF has been making a consistent series of lower highs and lower lows. The most recent lower high was formed on Oct. 24 at $50.61 and the most recent confirmed lower low was printed at the $43.46 mark the day prior.
TARK 排行榜: Tark於10月10日開始以下跌通道模式交易,在形態中,ETF一直創下一系列較低的高點和較低的低點。最近的較低高點於10月24日形成,爲50.61美元,最近確認的較低低點在前一天印在43.46美元大關。
- On Monday, TARK fell near the bottom descending trend line of the channel and was attempting to bounce up from that area. If the ETF closes the trading session with a lower wick, TARK will print a doji or hammer candlestick, which could indicate the next lower low has occurred and a bounce is on the horizon.
- If TARK can eventually rebound up to the upper trend line of the channel and possibly break above that area on higher-than-average volume, it could signal a longer-term reversal is on the horizon. If that happens, the ETF will also regain the eight-day exponential moving average, which would give bullish traders more confidence in the future.
- TARK has resistance above at $43.46 and at $48.74 and support below at $38.59 and at the psychologically important $35 mark.
- 週一,TARK跌至該通道的底部下降趨勢線附近,並試圖從該區域反彈。如果ETF以較低的燈芯結束交易時段,則TARK將打印十字星或錘形燭臺,這可能表明下一個較低的低點已經出現,並且即將出現反彈。
- 如果TARK最終能夠反彈至通道的上行趨勢線,並可能在高於平均水平的交易量上突破該區域,則可能預示着長期逆轉即將到來。如果發生這種情況,ETF還將重新獲得八天指數移動平均線,這將使看漲的交易者對未來更有信心。
- TARK的阻力位分別爲43.46美元和48.74美元,下方的支撐位爲38.59美元,心理上重要的35美元大關。
 Read Next: Cathie Wood Dumps Over $6M Grayscale Bitcoin Fund This Week As Bitcoin Rallies About 14%, While Amassing $12.4M Worth Of This Crypto-linked Stock
繼續閱讀:隨着比特幣上漲約14%,凱茜·伍德本週拋售了超過600萬美元的灰度比特幣基金,同時積累了價值1240萬美元的這隻與加密相關的股票
譯文內容由第三人軟體翻譯。
