
 Yahoo Finance
 Return Trends At E.A. Technique (M) Berhad (KLSE:EATECH) Aren't Appealing
If we want to find a potential multi-bagger, often there are underlying trends that can provide clues. Firstly, we'll want to see a proven return on capital employed (ROCE) that is increasing, and secondly, an expanding base of capital employed. Basically this means that a company has profitable initiatives that it can continue to reinvest in, which is a trait of a compounding machine. So while E.A. Technique (M) Berhad (KLSE:EATECH) has a high ROCE right now, lets see what we can decipher from how returns are changing.
Return On Capital Employed (ROCE): What Is It?
For those who don't know, ROCE is a measure of a company's yearly pre-tax profit (its return), relative to the capital employed in the business. Analysts use this formula to calculate it for E.A. Technique (M) Berhad:
Return on Capital Employed = Earnings Before Interest and Tax (EBIT) ÷ (Total Assets - Current Liabilities)
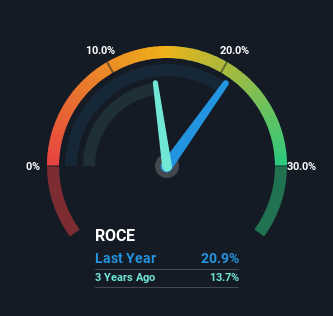
0.21 = RM33m ÷ (RM507m - RM350m) (Based on the trailing twelve months to June 2023).
So, E.A. Technique (M) Berhad has an ROCE of 21%. That's a fantastic return and not only that, it outpaces the average of 14% earned by companies in a similar industry.
View our latest analysis for E.A. Technique (M) Berhad
While the past is not representative of the future, it can be helpful to know how a company has performed historically, which is why we have this chart above. If you'd like to look at how E.A. Technique (M) Berhad has performed in the past in other metrics, you can view this free graph of past earnings, revenue and cash flow.
The Trend Of ROCE
Over the past five years, E.A. Technique (M) Berhad's ROCE has remained relatively flat while the business is using 70% less capital than before. To us that doesn't look like a multi-bagger because the company appears to be selling assets and it's returns aren't increasing. But we have to give it to E.A. Technique (M) Berhad because the returns on the capital it is employing are still high in relative terms.
On another note, while the change in ROCE trend might not scream for attention, it's interesting that the current liabilities have actually gone up over the last five years. This is intriguing because if current liabilities hadn't increased to 69% of total assets, this reported ROCE would probably be less than21% because total capital employed would be higher.The 21% ROCE could be even lower if current liabilities weren't 69% of total assets, because the the formula would show a larger base of total capital employed. So with current liabilities at such high levels, this effectively means the likes of suppliers or short-term creditors are funding a meaningful part of the business, which in some instances can bring some risks.
The Key Takeaway
It's a shame to see that E.A. Technique (M) Berhad is effectively shrinking in terms of its capital base. And in the last five years, the stock has given away 15% so the market doesn't look too hopeful on these trends strengthening any time soon. Therefore based on the analysis done in this article, we don't think E.A. Technique (M) Berhad has the makings of a multi-bagger.
On a final note, we found 4 warning signs for E.A. Technique (M) Berhad (3 are a bit unpleasant) you should be aware of.
High returns are a key ingredient to strong performance, so check out our free list ofstocks earning high returns on equity with solid balance sheets.
Have feedback on this article? Concerned about the content? Get in touch with us directly. Alternatively, email editorial-team (at) simplywallst.com.
This article by Simply Wall St is general in nature. We provide commentary based on historical data and analyst forecasts only using an unbiased methodology and our articles are not intended to be financial advice. It does not constitute a recommendation to buy or sell any stock, and does not take account of your objectives, or your financial situation. We aim to bring you long-term focused analysis driven by fundamental data. Note that our analysis may not factor in the latest price-sensitive company announcements or qualitative material. Simply Wall St has no position in any stocks mentioned.
