
 Yahoo Finance
 Thong Guan Industries Berhad (KLSE:TGUAN) shareholders have earned a 12% CAGR over the last five years
Thong Guan Industries Berhad (KLSE:TGUAN) shareholders might be concerned after seeing the share price drop 12% in the last quarter. On the bright side the returns have been quite good over the last half decade. It has returned a market beating 57% in that time. While the long term returns are impressive, we do have some sympathy for those who bought more recently, given the 29% drop, in the last year.
With that in mind, it's worth seeing if the company's underlying fundamentals have been the driver of long term performance, or if there are some discrepancies.
View our latest analysis for Thong Guan Industries Berhad
To quote Buffett, 'Ships will sail around the world but the Flat Earth Society will flourish. There will continue to be wide discrepancies between price and value in the marketplace...' One way to examine how market sentiment has changed over time is to look at the interaction between a company's share price and its earnings per share (EPS).
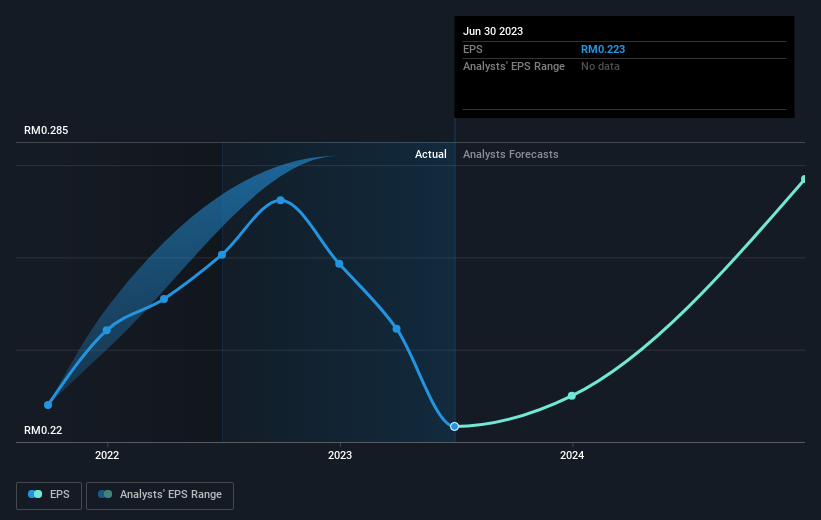
Over half a decade, Thong Guan Industries Berhad managed to grow its earnings per share at 13% a year. The EPS growth is more impressive than the yearly share price gain of 9% over the same period. So one could conclude that the broader market has become more cautious towards the stock. This cautious sentiment is reflected in its (fairly low) P/E ratio of 8.30.
The graphic below depicts how EPS has changed over time (unveil the exact values by clicking on the image).
We're pleased to report that the CEO is remunerated more modestly than most CEOs at similarly capitalized companies. It's always worth keeping an eye on CEO pay, but a more important question is whether the company will grow earnings throughout the years. It might be well worthwhile taking a look at our free report on Thong Guan Industries Berhad's earnings, revenue and cash flow.
What About Dividends?
As well as measuring the share price return, investors should also consider the total shareholder return (TSR). The TSR is a return calculation that accounts for the value of cash dividends (assuming that any dividend received was reinvested) and the calculated value of any discounted capital raisings and spin-offs. It's fair to say that the TSR gives a more complete picture for stocks that pay a dividend. We note that for Thong Guan Industries Berhad the TSR over the last 5 years was 77%, which is better than the share price return mentioned above. This is largely a result of its dividend payments!
A Different Perspective
Investors in Thong Guan Industries Berhad had a tough year, with a total loss of 28% (including dividends), against a market gain of about 9.0%. Even the share prices of good stocks drop sometimes, but we want to see improvements in the fundamental metrics of a business, before getting too interested. On the bright side, long term shareholders have made money, with a gain of 12% per year over half a decade. It could be that the recent sell-off is an opportunity, so it may be worth checking the fundamental data for signs of a long term growth trend. It's always interesting to track share price performance over the longer term. But to understand Thong Guan Industries Berhad better, we need to consider many other factors. Case in point: We've spotted 1 warning sign for Thong Guan Industries Berhad you should be aware of.
If you are like me, then you will not want to miss this free list of growing companies that insiders are buying.
Please note, the market returns quoted in this article reflect the market weighted average returns of stocks that currently trade on Malaysian exchanges.
Have feedback on this article? Concerned about the content? Get in touch with us directly. Alternatively, email editorial-team (at) simplywallst.com.
This article by Simply Wall St is general in nature. We provide commentary based on historical data and analyst forecasts only using an unbiased methodology and our articles are not intended to be financial advice. It does not constitute a recommendation to buy or sell any stock, and does not take account of your objectives, or your financial situation. We aim to bring you long-term focused analysis driven by fundamental data. Note that our analysis may not factor in the latest price-sensitive company announcements or qualitative material. Simply Wall St has no position in any stocks mentioned.
