
A "broker" can be simply understood as a securities firm, and the exchange is officially defined as a "market intermediary / investor account holder who is willing to disclose", where:
Market intermediaries: CCASS participants including non-investor account holders
Investor account holders who are willing to disclose: investment account holders who are willing to disclose their shareholding records
The proportion of shares held by the broker = the number of shares held by the broker / the number of shares issued.
The changes in the shareholding ratio of the brokers with the highest holdings can to a certain extent reflect the attitude of institutional investors towards the future share price. Here is a practical example:
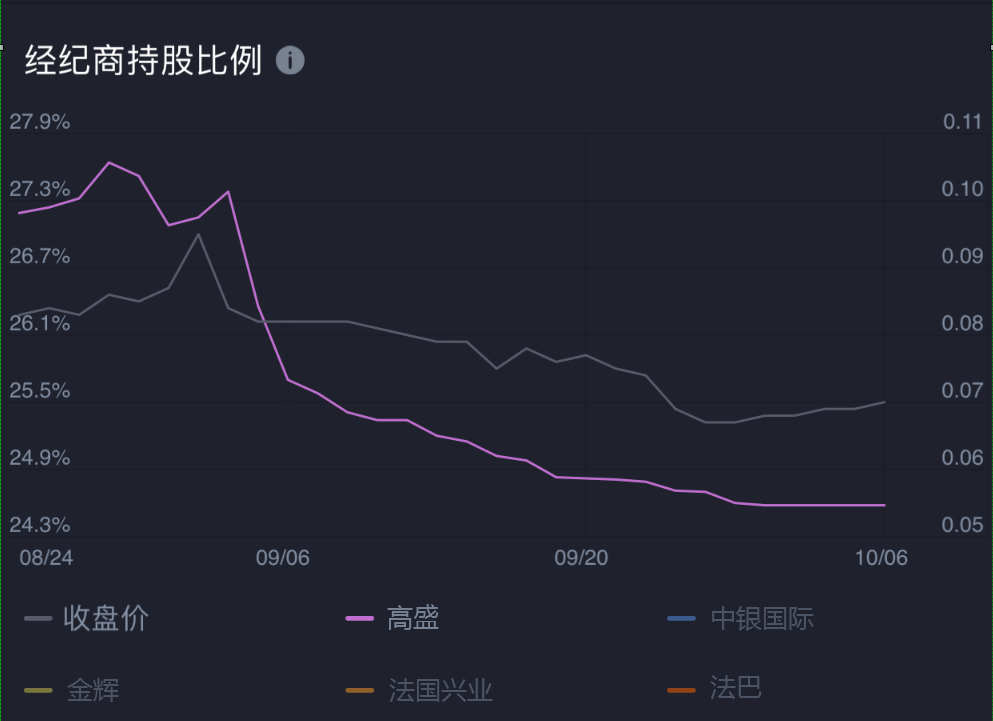
In the picture above, the number one broker, China Securities Registration and Clearing Co., Ltd., has a very positive correlation between its shareholding and the trend of its share price. The behavior of buying and selling stocks can affect the shareholding ratio of the corresponding securities firms, and this kind of investors are likely to be investors with financial strength, professional and institutional nature. The fundamental research and technical analysis ability of this kind of investors is far stronger than that of ordinary retail investors, and their attitude towards stocks determines the future trend of stock prices to some extent.
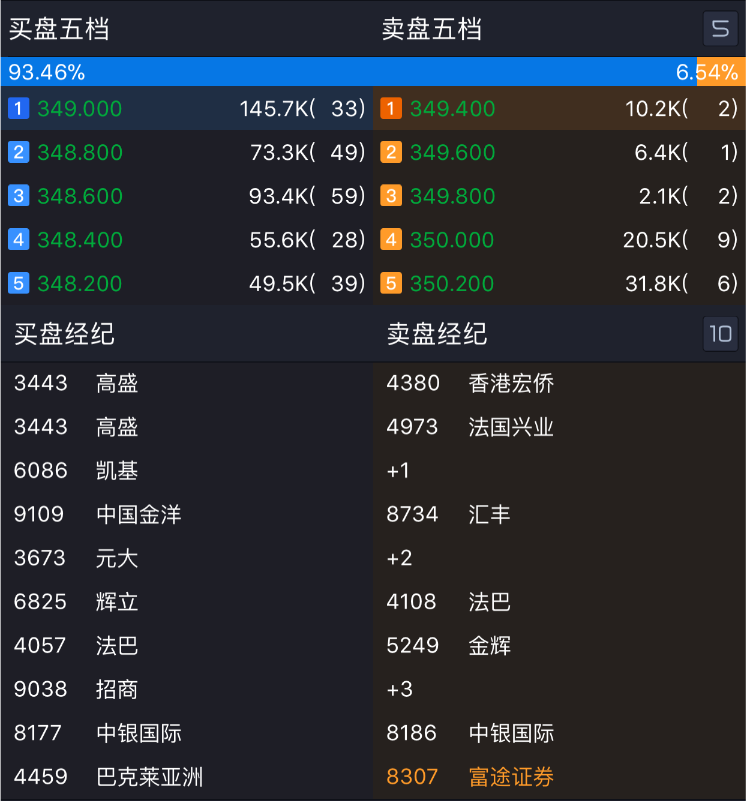
In addition, we can make use of the LV2 market of Fortune Hong Kong stocks, combined with the corresponding brokerage seats in the ten trading stalls to conduct a comprehensive analysis. If there are a large number of large orders from a certain broker in the trading market for a continuous period of time, it shows that there may be a change in the attitude of institutional investors towards the future stock price.
Special note: changes in brokers' shareholding data are not necessarily caused by secondary market transactions, but also include data changes caused by investors changing positions between brokerages. Therefore, whenIt is also normal that the change in the shareholding ratio of a broker is greater than the trading volume of the day..
From the perspective of brokers' shareholding, the actions of all brokers add up to affect the stock price, not just by the actions of individual brokers. The above is just an extreme case, the stock price trend is very positively related to the shareholding ratio of a broker, but the performance of most stocks will not be so simple, and the "broker shareholding ratio" chart only provides an analytical tool.
For the record, this point of view does not constitute any investment advice. There are many factors that affect the stock price, so we must not make a buying and selling decision based on an one-sided chart analysis.