
NVIDIA Stock Pops Higher Following Inflation Data: The Bull, Bear Case For The Chipmaker
NVIDIA Stock Pops Higher Following Inflation Data: The Bull, Bear Case For The Chipmaker
NVIDIA Corporation (NASDAQ:NVDA) was popping up about 2% at one point Friday, in tandem with the general market, after core Personal Consumption Expenditure data cooled to its lowest reading since September 2021.
英偉達公司 納斯達克股票代碼:NVDA)週五一度上漲約2%,此前核心個人消費支出數據降至2021年9月以來的最低水平。
Unlike several other big-tech stocks, Nvidia hasn't found itself under regulatory scrutiny until Thursday, when it was reported that French officials raided several of the company's offices as part of a probe into potential anticompetitive practices.
與其他幾隻大型科技股不同,英偉達直到週四才發現自己受到監管部門的審查,當時有報道稱,作爲對潛在反競爭行爲的調查的一部分,法國官員突擊搜查了該公司的幾個辦公室。
While the news didn't appear to immediately negatively impact shares of Nvidia, technical indicators on the stock's chart show the local top may be in and a retracement could be on the horizon.
儘管這一消息似乎並未立即對英偉達的股票產生負面影響,但該股圖表上的技術指標顯示,可能會出現局部頂部,並且可能即將出現回調。
Nvidia is trading in a confirmed downtrend and on Friday, the stock looked to be printing a bearish top pattern.
英偉達的交易價格已確認下跌,週五,該股似乎呈現看跌的頂部模式。
Bearish On Nvidia? Short-term traders looking to hedge a long position, play the dips within a potential continued uptrend or those who believe Nvidia will suffer a bearish reaction to its earnings print, can play retracements using the AXS 1.25x NVDA Bear Daily ETF (NASDAQ:NVDS).
看跌英偉達? 短期交易者希望對沖多頭頭寸,在潛在的持續上漲趨勢中逢低買入,或者那些認爲英偉達將對其業績產生看跌反應的短期交易者,可以使用 AXS 1.25x NVDA 熊市每日交易所買賣基金 (納斯達克股票代碼:NVDS)。
NVDS is a leveraged ETF aiming to track 125% of the opposite daily performance of NVDA. This leverage boosts trade performance, potentially turning small, brief dips in Nvidia's stock into significant gains for traders. Using this ETF eliminates the need to borrow NVDA stock from your broker to sell short, offering retail traders an easy and convenient way to play Nvidia bearishly.
NVDS是一種槓桿ETF,旨在追蹤與NVDA相反每日表現的125%。這種槓桿作用提振了交易表現,有可能將英偉達股票的小幅短暫下跌轉化爲交易者的可觀收益。使用此ETF無需向經紀商借入NVDA股票來賣空,從而爲散戶交易者提供了一種看跌Nvidia的簡單便捷方式。
Want direct analysis? Find me in the BZ Pro lounge! Click here for a free trial.
想要直接分析?在 BZ Pro 休息室找我!點擊此處免費試用。
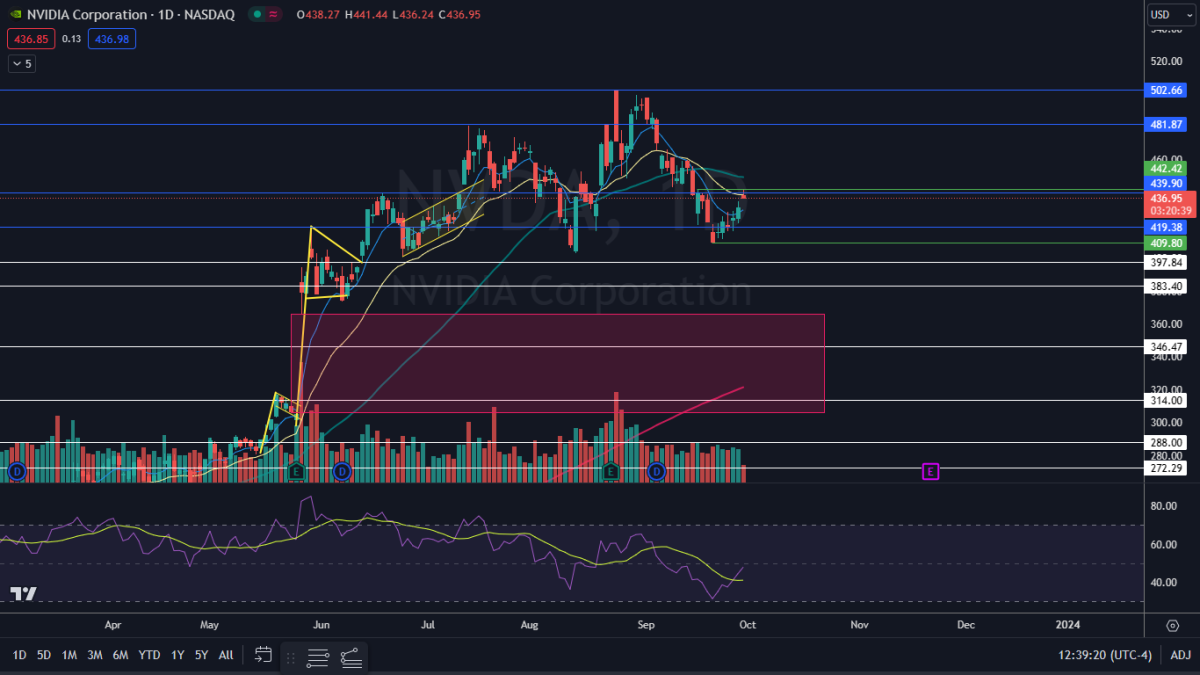
The Nvidia Chart: When Nvidia rose to its high-of-day, the stock rejected the $442.42 mark and formed a double top pattern, when paired with similar price action on Sept. 18. The rise to that level and the subsequent drop also caused the stock to form a shooting star candlestick, which suggests the local top may have occurred and Nvidia will fall lower on Monday.
Nvidia 排行榜: 當英偉達升至當日高點時,該股突破了442.42美元大關,形成了雙頂模式,再加上9月18日的類似價格走勢。升至該水平以及隨後的下跌也導致該股形成流星燭臺,這表明可能已經出現了局部頂部,英偉達將在週一下跌。
- Because Nvidia couldn't break through the $442 area, the stock was unable to form a higher high, which suggests the downtrend may remain intact. If Nvidia falls lower next week but rebounds before breaking below $409.80, a higher low will form, however, which will negate the downtrend.
- If Nvidia's downtrend continues, the stock will eventually fall into a gap that exists between $306.07 and $366.35. If that happens, the stock is likely to find support at the bottom range of that area.
- Bullish traders want to see big bullish volume come in and drive Nvidia up above $442, which would negate the double top pattern.
- Nvidia has resistance above at $439.90 and at $481.87 and support below at $419.38 and at $397.84.
- 由於英偉達無法突破442美元的區域,該股無法形成更高的高點,這表明下跌趨勢可能保持不變。但是,如果英偉達下週下跌但在跌破409.80美元之前反彈,則將形成更高的低點,這將抵消下跌趨勢。
- 如果英偉達的下跌趨勢繼續下去,該股最終將跌入306.07美元至366.35美元之間的缺口。如果發生這種情況,該股很可能會在該區域的底部區間找到支撐。
- 看漲的交易者希望看到大量的看漲成交量進來,推動英偉達升至442美元以上,這將抵消雙頂模式。
- 英偉達的阻力位高於439.90美元和481.87美元,下方的支撐位在419.38美元和397.84美元。
 Read Next: Pinterest, Cloudflare And 2 Other Stocks Insiders Are Selling
繼續閱讀:Pinterest、Cloudflare 和其他兩隻股票內部人士正在出售
譯文內容由第三人軟體翻譯。