
 Yahoo Finance
 CNMC Goldmine Holdings' (Catalist:5TP) Returns On Capital Are Heading Higher
If you're looking for a multi-bagger, there's a few things to keep an eye out for. Ideally, a business will show two trends; firstly a growing return on capital employed (ROCE) and secondly, an increasing amount of capital employed. Basically this means that a company has profitable initiatives that it can continue to reinvest in, which is a trait of a compounding machine. So when we looked at CNMC Goldmine Holdings (Catalist:5TP) and its trend of ROCE, we really liked what we saw.
Understanding Return On Capital Employed (ROCE)
Just to clarify if you're unsure, ROCE is a metric for evaluating how much pre-tax income (in percentage terms) a company earns on the capital invested in its business. Analysts use this formula to calculate it for CNMC Goldmine Holdings:
Return on Capital Employed = Earnings Before Interest and Tax (EBIT) ÷ (Total Assets - Current Liabilities)
0.088 = US$4.3m ÷ (US$59m - US$10m) (Based on the trailing twelve months to June 2023).
Therefore, CNMC Goldmine Holdings has an ROCE of 8.8%. Even though it's in line with the industry average of 8.8%, it's still a low return by itself.
Check out our latest analysis for CNMC Goldmine Holdings
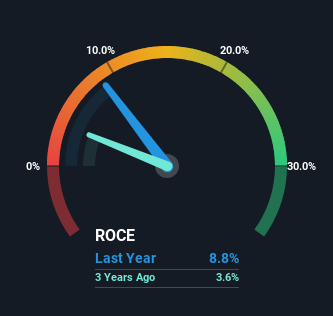
Historical performance is a great place to start when researching a stock so above you can see the gauge for CNMC Goldmine Holdings' ROCE against it's prior returns. If you're interested in investigating CNMC Goldmine Holdings' past further, check out this free graph of past earnings, revenue and cash flow.
So How Is CNMC Goldmine Holdings' ROCE Trending?
CNMC Goldmine Holdings is showing promise given that its ROCE is trending up and to the right. Looking at the data, we can see that even though capital employed in the business has remained relatively flat, the ROCE generated has risen by 280% over the last five years. So it's likely that the business is now reaping the full benefits of its past investments, since the capital employed hasn't changed considerably. It's worth looking deeper into this though because while it's great that the business is more efficient, it might also mean that going forward the areas to invest internally for the organic growth are lacking.
The Key Takeaway
As discussed above, CNMC Goldmine Holdings appears to be getting more proficient at generating returns since capital employed has remained flat but earnings (before interest and tax) are up. And given the stock has remained rather flat over the last five years, there might be an opportunity here if other metrics are strong. With that in mind, we believe the promising trends warrant this stock for further investigation.
Since virtually every company faces some risks, it's worth knowing what they are, and we've spotted 2 warning signs for CNMC Goldmine Holdings (of which 1 is a bit unpleasant!) that you should know about.
If you want to search for solid companies with great earnings, check out this free list of companies with good balance sheets and impressive returns on equity.
Have feedback on this article? Concerned about the content? Get in touch with us directly. Alternatively, email editorial-team (at) simplywallst.com.
This article by Simply Wall St is general in nature. We provide commentary based on historical data and analyst forecasts only using an unbiased methodology and our articles are not intended to be financial advice. It does not constitute a recommendation to buy or sell any stock, and does not take account of your objectives, or your financial situation. We aim to bring you long-term focused analysis driven by fundamental data. Note that our analysis may not factor in the latest price-sensitive company announcements or qualitative material. Simply Wall St has no position in any stocks mentioned.
