Is Hubify Limited's (ASX:HFY) Stock Price Struggling As A Result Of Its Mixed Financials?
Hubify (ASX:HFY) has had a rough month with its share price down 18%. It is possible that the markets have ignored the company's differing financials and decided to lean-in to the negative sentiment. Stock prices are usually driven by a company’s financial performance over the long term, and therefore we decided to pay more attention to the company's financial performance. Specifically, we decided to study Hubify's ROE in this article.
Return on equity or ROE is a key measure used to assess how efficiently a company's management is utilizing the company's capital. In other words, it is a profitability ratio which measures the rate of return on the capital provided by the company's shareholders.
Check out our latest analysis for Hubify
How Do You Calculate Return On Equity?
The formula for ROE is:
Return on Equity = Net Profit (from continuing operations) ÷ Shareholders' Equity
So, based on the above formula, the ROE for Hubify is:
4.4% = AU$512k ÷ AU$12m (Based on the trailing twelve months to June 2023).
The 'return' is the amount earned after tax over the last twelve months. That means that for every A$1 worth of shareholders' equity, the company generated A$0.04 in profit.
Why Is ROE Important For Earnings Growth?
We have already established that ROE serves as an efficient profit-generating gauge for a company's future earnings. Based on how much of its profits the company chooses to reinvest or "retain", we are then able to evaluate a company's future ability to generate profits. Generally speaking, other things being equal, firms with a high return on equity and profit retention, have a higher growth rate than firms that don’t share these attributes.
A Side By Side comparison of Hubify's Earnings Growth And 4.4% ROE
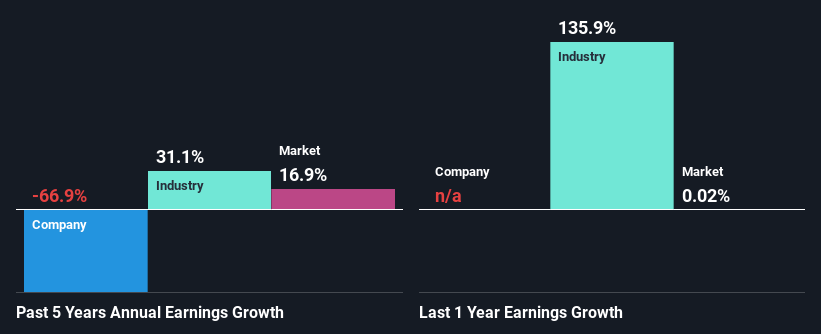
When you first look at it, Hubify's ROE doesn't look that attractive. We then compared the company's ROE to the broader industry and were disappointed to see that the ROE is lower than the industry average of 6.9%. For this reason, Hubify's five year net income decline of 67% is not surprising given its lower ROE. We reckon that there could also be other factors at play here. For example, it is possible that the business has allocated capital poorly or that the company has a very high payout ratio.
That being said, we compared Hubify's performance with the industry and were concerned when we found that while the company has shrunk its earnings, the industry has grown its earnings at a rate of 31% in the same 5-year period.
The basis for attaching value to a company is, to a great extent, tied to its earnings growth. What investors need to determine next is if the expected earnings growth, or the lack of it, is already built into the share price. Doing so will help them establish if the stock's future looks promising or ominous. Is Hubify fairly valued compared to other companies? These 3 valuation measures might help you decide.
Is Hubify Using Its Retained Earnings Effectively?
Hubify doesn't pay any dividend, meaning that potentially all of its profits are being reinvested in the business, which doesn't explain why the company's earnings have shrunk if it is retaining all of its profits. It looks like there might be some other reasons to explain the lack in that respect. For example, the business could be in decline.
Summary
Overall, we have mixed feelings about Hubify. Even though it appears to be retaining most of its profits, given the low ROE, investors may not be benefitting from all that reinvestment after all. The low earnings growth suggests our theory correct. Wrapping up, we would proceed with caution with this company and one way of doing that would be to look at the risk profile of the business. To know the 4 risks we have identified for Hubify visit our risks dashboard for free.
Have feedback on this article? Concerned about the content? Get in touch with us directly. Alternatively, email editorial-team (at) simplywallst.com.
This article by Simply Wall St is general in nature. We provide commentary based on historical data and analyst forecasts only using an unbiased methodology and our articles are not intended to be financial advice. It does not constitute a recommendation to buy or sell any stock, and does not take account of your objectives, or your financial situation. We aim to bring you long-term focused analysis driven by fundamental data. Note that our analysis may not factor in the latest price-sensitive company announcements or qualitative material. Simply Wall St has no position in any stocks mentioned.
