
O-I Glass, Inc. (NYSE:OI) Shares Could Be 43% Below Their Intrinsic Value Estimate
O-I Glass, Inc. (NYSE:OI) Shares Could Be 43% Below Their Intrinsic Value Estimate
 We're using the 2-stage growth model, which simply means we take in account two stages of company's growth. In the initial period the company may have a higher growth rate and the second stage is usually assumed to have a stable growth rate. To begin with, we have to get estimates of the next ten years of cash flows. Where possible we use analyst estimates, but when these aren't available we extrapolate the previous free cash flow (FCF) from the last estimate or reported value. We assume companies with shrinking free cash flow will slow their rate of shrinkage, and that companies with growing free cash flow will see their growth rate slow, over this period. We do this to reflect that growth tends to slow more in the early years than it does in later years.
 Key Insights
主要見解
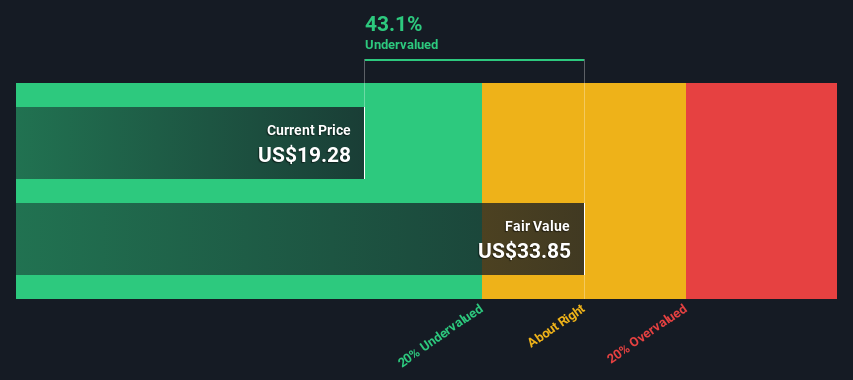
- O-I Glass' estimated fair value is US$33.85 based on 2 Stage Free Cash Flow to Equity
- O-I Glass' US$19.28 share price signals that it might be 43% undervalued
- Analyst price target for OI is US$26.10 which is 23% below our fair value estimate
- O-I Glass基於兩階段自由現金流轉股權的估計公允價值為33.85美元
- O-I Glass 19.28美元的股價表明它可能被低估了43%
- 分析師對OI的目標價為26.10美元,比我們的公允價值估計低23%
How far off is O-I Glass, Inc. (NYSE:OI) from its intrinsic value? Using the most recent financial data, we'll take a look at whether the stock is fairly priced by estimating the company's future cash flows and discounting them to their present value. We will take advantage of the Discounted Cash Flow (DCF) model for this purpose. Don't get put off by the jargon, the math behind it is actually quite straightforward.
O-I Glass,Inc.(紐約證券交易所代碼:OI)距離其內在價值還有多遠?使用最新的財務數據,我們將通過估計公司未來的現金流並將其貼現到現值,來看看股票的定價是否公平。為此,我們將利用貼現現金流(DCF)模型。不要被行話嚇跑了,它背後的數學實際上是相當簡單的。
We generally believe that a company's value is the present value of all of the cash it will generate in the future. However, a DCF is just one valuation metric among many, and it is not without flaws. If you want to learn more about discounted cash flow, the rationale behind this calculation can be read in detail in the Simply Wall St analysis model.
我們通常認為,一家公司的價值是它未來將產生的所有現金的現值。然而,貼現現金流只是眾多估值指標中的一個,它也並非沒有缺陷。如果你想了解更多關於貼現現金流的資訊,可以在Simply Wall St.分析模型中詳細閱讀這種計算背後的原理。
View our latest analysis for O-I Glass
查看我們對O-I玻璃的最新分析
What's The Estimated Valuation?
估計的估價是多少?
We're using the 2-stage growth model, which simply means we take in account two stages of company's growth. In the initial period the company may have a higher growth rate and the second stage is usually assumed to have a stable growth rate. To begin with, we have to get estimates of the next ten years of cash flows. Where possible we use analyst estimates, but when these aren't available we extrapolate the previous free cash flow (FCF) from the last estimate or reported value. We assume companies with shrinking free cash flow will slow their rate of shrinkage, and that companies with growing free cash flow will see their growth rate slow, over this period. We do this to reflect that growth tends to slow more in the early years than it does in later years.
我們使用的是兩階段增長模型,也就是說,我們考慮了公司發展的兩個階段。在初期,公司可能有較高的增長率,而第二階段通常被假設為有一個穩定的增長率。首先,我們必須對未來十年的現金流進行估計。在可能的情況下,我們使用分析師的估計,但當這些估計不可用時,我們會根據上次估計或報告的價值推斷先前的自由現金流(FCF)。我們假設,自由現金流萎縮的公司將減緩收縮速度,而自由現金流增長的公司在這段時間內的增長速度將放緩。我們這樣做是為了反映出,增長在最初幾年往往比後來幾年放緩得更多。
Generally we assume that a dollar today is more valuable than a dollar in the future, so we need to discount the sum of these future cash flows to arrive at a present value estimate:
一般來說,我們假設今天的一美元比未來的一美元更有價值,因此我們需要對這些未來現金流的總和進行貼現,以得出現值估計:
10-year free cash flow (FCF) forecast
10年自由現金流(Fcf)預測
| 2024 | 2025 | 2026 | 2027 | 2028 | 2029 | 2030 | 2031 | 2032 | 2033 | |
| Levered FCF ($, Millions) | US$587.6m | US$245.0m | US$380.0m | US$428.0m | US$405.6m | US$393.4m | US$387.6m | US$386.2m | US$387.6m | US$391.1m |
| Growth Rate Estimate Source | Analyst x3 | Analyst x1 | Analyst x1 | Analyst x1 | Est @ -5.23% | Est @ -3.01% | Est @ -1.47% | Est @ -0.38% | Est @ 0.38% | Est @ 0.91% |
| Present Value ($, Millions) Discounted @ 8.7% | US$540 | US$207 | US$296 | US$306 | US$267 | US$238 | US$216 | US$198 | US$183 | US$169 |
| 二零二四年 | 2025年年 | 二零二六年 | 2027年年 | 2028年年 | 2029年年 | 二0三0 | 2031年年 | 2032年年 | 2033年 | |
| 槓桿式Fcf(百萬美元) | 5.876億美元 | 2.45億美元 | 3.80億美元 | 4.28億美元 | 4.056億美元 | 3.934億美元 | 3.876億美元 | 3.862億美元 | 3.876億美元 | 3.911億美元 |
| 增長率預估來源 | 分析師x3 | 分析師x1 | 分析師x1 | 分析師x1 | Est@-5.23% | Est@-3.01% | Est@-1.47% | Est@-0.38% | Est@0.38% | Est@0.91% |
| 現值(美元,百萬)貼現@8.7% | 540美元 | 207美元 | 296美元 | 306美元 | 267美元 | 238美元 | 216美元 | 198美元 | 183美元 | 169美元 |
("Est" = FCF growth rate estimated by Simply Wall St)
Present Value of 10-year Cash Flow (PVCF) = US$2.6b
(“美國東部時間”=Simply Wall St.預估的Fcf成長率)
10年期現金流現值(聚偏氟乙烯)=26億美元
We now need to calculate the Terminal Value, which accounts for all the future cash flows after this ten year period. For a number of reasons a very conservative growth rate is used that cannot exceed that of a country's GDP growth. In this case we have used the 5-year average of the 10-year government bond yield (2.2%) to estimate future growth. In the same way as with the 10-year 'growth' period, we discount future cash flows to today's value, using a cost of equity of 8.7%.
我們現在需要計算終端價值,它說明瞭這十年之後的所有未來現金流。出於一些原因,使用了一個非常保守的增長率,不能超過一個國家的國內生產總值增長率。在這種情況下,我們使用了10年期政府債券收益率的5年平均值(2.2%)來估計未來的增長。與10年“增長”期一樣,我們使用8.7%的權益成本,將未來現金流貼現到今天的價值。
Terminal Value (TV)= FCF2033 × (1 + g) ÷ (r – g) = US$391m× (1 + 2.2%) ÷ (8.7%– 2.2%) = US$6.1b
終端值(電視)=FCF2033年×(1+g)?(r-g)=3.91億美元×(1+2.2%)?(8.7%-2.2%)=61億美元
Present Value of Terminal Value (PVTV)= TV / (1 + r)10= US$6.1b÷ ( 1 + 8.7%)10= US$2.6b
終值現值(PVTV)=TV/(1+r)10=61億美元?(1+8.7%)10=26億美元
The total value, or equity value, is then the sum of the present value of the future cash flows, which in this case is US$5.2b. To get the intrinsic value per share, we divide this by the total number of shares outstanding. Relative to the current share price of US$19.3, the company appears quite undervalued at a 43% discount to where the stock price trades currently. The assumptions in any calculation have a big impact on the valuation, so it is better to view this as a rough estimate, not precise down to the last cent.
那麼,總價值或權益價值就是未來現金流的現值之和,在這種情況下,現金流的現值為52億美元。為了得到每股內在價值,我們將其除以總流通股數量。相對於目前19.3美元的股價,該公司的估值似乎比目前的股價有43%的折讓。任何計算中的假設都會對估值產生很大影響,因此最好將其視為粗略估計,而不是精確到最後一分錢。
Important Assumptions
重要假設
Now the most important inputs to a discounted cash flow are the discount rate, and of course, the actual cash flows. Part of investing is coming up with your own evaluation of a company's future performance, so try the calculation yourself and check your own assumptions. The DCF also does not consider the possible cyclicality of an industry, or a company's future capital requirements, so it does not give a full picture of a company's potential performance. Given that we are looking at O-I Glass as potential shareholders, the cost of equity is used as the discount rate, rather than the cost of capital (or weighted average cost of capital, WACC) which accounts for debt. In this calculation we've used 8.7%, which is based on a levered beta of 1.316. Beta is a measure of a stock's volatility, compared to the market as a whole. We get our beta from the industry average beta of globally comparable companies, with an imposed limit between 0.8 and 2.0, which is a reasonable range for a stable business.
現在,貼現現金流最重要的投入是貼現率,當然還有實際現金流。投資的一部分是你自己對一家公司未來業績的評估,所以你自己試一試計算,檢查你自己的假設。DCF也沒有考慮一個行業可能的週期性,也沒有考慮一家公司未來的資本要求,因此它沒有給出一家公司潛在業績的全貌。鑑於我們將O-I Glass視為潛在股東,股權成本被用作貼現率,而不是佔債務的資本成本(或加權平均資本成本,WACC)。在這個計算中,我們使用了8.7%,這是基於槓桿率為1.316的測試值。貝塔係數是衡量一隻股票相對於整個市場的波動性的指標。我們的貝塔係數來自全球可比公司的行業平均貝塔係數,強制限制在0.8到2.0之間,這是一個穩定業務的合理範圍。
SWOT Analysis for O-I Glass
O-I玻璃的SWOT分析
- Earnings growth over the past year exceeded the industry.
- 過去一年的收益增長超過了行業.
- Debt is well covered by earnings.
- 盈利很好地彌補了債務。
- Balance sheet summary for OI.
- 其他投資的資產負債表摘要。
- Earnings growth over the past year is below its 5-year average.
- 過去一年的盈利增長低於5年平均水準.
- Good value based on P/E ratio and estimated fair value.
- 基於本益比和估計公允價值的良好價值。
- Debt is not well covered by operating cash flow.
- 運營現金流無法很好地覆蓋債務。
- Annual earnings are forecast to decline for the next 3 years.
- 預計未來三年的年收入將會下降。
- Is OI well equipped to handle threats?
- OI是否做好了應對威脅的準備?
Moving On:
下一步:
Although the valuation of a company is important, it ideally won't be the sole piece of analysis you scrutinize for a company. The DCF model is not a perfect stock valuation tool. Preferably you'd apply different cases and assumptions and see how they would impact the company's valuation. For example, changes in the company's cost of equity or the risk free rate can significantly impact the valuation. What is the reason for the share price sitting below the intrinsic value? For O-I Glass, we've compiled three additional elements you should look at:
儘管一家公司的估值很重要,但理想情況下,它不會是你為一家公司仔細審查的唯一一項分析。貼現現金流模型並不是一個完美的股票估值工具。你最好應用不同的案例和假設,看看它們會如何影響公司的估值。例如,公司權益成本或無風險利率的變化可能會對估值產生重大影響。股價低於內在價值的原因是什麼?對於O-I Glass,我們匯編了三個額外的元素,你應該看看:
- Risks: You should be aware of the 2 warning signs for O-I Glass we've uncovered before considering an investment in the company.
- Future Earnings: How does OI's growth rate compare to its peers and the wider market? Dig deeper into the analyst consensus number for the upcoming years by interacting with our free analyst growth expectation chart.
- Other Solid Businesses: Low debt, high returns on equity and good past performance are fundamental to a strong business. Why not explore our interactive list of stocks with solid business fundamentals to see if there are other companies you may not have considered!
- 風險:你應該意識到O-I玻璃的2個警告標誌我們在考慮投資該公司之前發現了這一點。
- 未來收益:與同行和更廣泛的市場相比,OI的增長速度如何?通過與我們的免費分析師增長預期圖表互動,更深入地挖掘分析師對未來幾年的共識數位。
- 其他穩固的企業:低債務、高股本回報率和良好的過去業績是強勁業務的基礎。為什麼不探索我們具有堅實商業基本面的股票的互動列表,看看是否有其他您可能沒有考慮過的公司!
PS. The Simply Wall St app conducts a discounted cash flow valuation for every stock on the NYSE every day. If you want to find the calculation for other stocks just search here.
備註:Simplp Wall St.應用每天對紐約證交所的每隻股票進行現金流貼現估值.如果你想找到其他股票的計算方法,只需蒐索此處.
Have feedback on this article? Concerned about the content? Get in touch with us directly. Alternatively, email editorial-team (at) simplywallst.com.
This article by Simply Wall St is general in nature. We provide commentary based on historical data and analyst forecasts only using an unbiased methodology and our articles are not intended to be financial advice. It does not constitute a recommendation to buy or sell any stock, and does not take account of your objectives, or your financial situation. We aim to bring you long-term focused analysis driven by fundamental data. Note that our analysis may not factor in the latest price-sensitive company announcements or qualitative material. Simply Wall St has no position in any stocks mentioned.
對這篇文章有什麼反饋嗎?擔心內容嗎? 保持聯繫直接與我們聯繫.或者,也可以給編輯組發電子郵件,地址是暗示Wallst.com。
本文由Simply Wall St.撰寫,具有概括性.我們僅使用不偏不倚的方法提供基於歷史數據和分析師預測的評論,我們的文章並不打算作為財務建議.它不構成買賣任何股票的建議,也沒有考慮你的目標或你的財務狀況.我們的目標是為您帶來由基本面數據驅動的長期重點分析.請注意,我們的分析可能不會將最新的對價格敏感的公司公告或定性材料考慮在內.Simply Wall St.對上述任何一隻股票都沒有持倉.
譯文內容由第三人軟體翻譯。
