Kamdar Group (M) Berhad (KLSE:KAMDAR) Will Be Hoping To Turn Its Returns On Capital Around
If we're looking to avoid a business that is in decline, what are the trends that can warn us ahead of time? Businesses in decline often have two underlying trends, firstly, a declining return on capital employed (ROCE) and a declining base of capital employed. Basically the company is earning less on its investments and it is also reducing its total assets. And from a first read, things don't look too good at Kamdar Group (M) Berhad (KLSE:KAMDAR), so let's see why.
Understanding Return On Capital Employed (ROCE)
For those that aren't sure what ROCE is, it measures the amount of pre-tax profits a company can generate from the capital employed in its business. To calculate this metric for Kamdar Group (M) Berhad, this is the formula:
Return on Capital Employed = Earnings Before Interest and Tax (EBIT) ÷ (Total Assets - Current Liabilities)
0.0029 = RM784k ÷ (RM295m - RM28m) (Based on the trailing twelve months to March 2023).
Thus, Kamdar Group (M) Berhad has an ROCE of 0.3%. Ultimately, that's a low return and it under-performs the Specialty Retail industry average of 19%.
See our latest analysis for Kamdar Group (M) Berhad
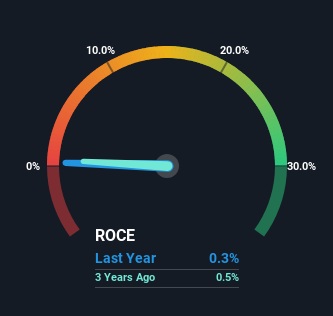
Historical performance is a great place to start when researching a stock so above you can see the gauge for Kamdar Group (M) Berhad's ROCE against it's prior returns. If you're interested in investigating Kamdar Group (M) Berhad's past further, check out this free graph of past earnings, revenue and cash flow.
The Trend Of ROCE
In terms of Kamdar Group (M) Berhad's historical ROCE movements, the trend doesn't inspire confidence. Unfortunately the returns on capital have diminished from the 2.4% that they were earning five years ago. Meanwhile, capital employed in the business has stayed roughly the flat over the period. This combination can be indicative of a mature business that still has areas to deploy capital, but the returns received aren't as high due potentially to new competition or smaller margins. If these trends continue, we wouldn't expect Kamdar Group (M) Berhad to turn into a multi-bagger.
What We Can Learn From Kamdar Group (M) Berhad's ROCE
All in all, the lower returns from the same amount of capital employed aren't exactly signs of a compounding machine. It should come as no surprise then that the stock has fallen 55% over the last five years, so it looks like investors are recognizing these changes. Unless there is a shift to a more positive trajectory in these metrics, we would look elsewhere.
One more thing: We've identified 3 warning signs with Kamdar Group (M) Berhad (at least 2 which are a bit unpleasant) , and understanding these would certainly be useful.
If you want to search for solid companies with great earnings, check out this free list of companies with good balance sheets and impressive returns on equity.
Have feedback on this article? Concerned about the content? Get in touch with us directly. Alternatively, email editorial-team (at) simplywallst.com.
This article by Simply Wall St is general in nature. We provide commentary based on historical data and analyst forecasts only using an unbiased methodology and our articles are not intended to be financial advice. It does not constitute a recommendation to buy or sell any stock, and does not take account of your objectives, or your financial situation. We aim to bring you long-term focused analysis driven by fundamental data. Note that our analysis may not factor in the latest price-sensitive company announcements or qualitative material. Simply Wall St has no position in any stocks mentioned.
